We are delighted to share the news of FusionChart’s most recent release, version 3.22 – a pivotal moment in our ongoing dedication to delivering powerful and flexible data visualization solutions.
This release heralds a groundbreaking advancement as we proudly introduce seamless integration with Blazor, opening up a realm of new possibilities for dynamic and interactive charting within Blazor applications.
Let’s see how we can make Blazor and FusionCharts interoperate.
Table of Contents
Fuel apps with rich data visualization
User-friendliness is at the heart of FusionCharts, and our newest integration with Blazor makes it easier than ever. Integrating FusionCharts into Blazor applications can help you create visually appealing and informative data visualizations, enhancing the overall user experience in several ways:
Rich Data Visualization:
The FusionCharts charting library offers a wide range of customizable and interactive charts. By creating Blazor wrapper components around FusionCharts, you can easily incorporate responsive charts that adapt to different screen sizes and user interactions. This helps in building dynamic and user-friendly dashboards within your Blazor applications.
Feature-Rich configuration:
FusionCharts comes with extensive configuration options, allowing developers to fine-tune the appearance and behavior of charts. Integrating FusionCharts with Blazor provides developers with a powerful set of tools to configure and customize charts according to their application’s requirements.
Bring your ideas to fruition with unparalleled speed:
For our performance enthusiasts, the Blazor integration brings a significant boost in charting performance. The performance optimization inherent to FusionCharts ensures efficient client-side rendering, contributing to faster chart display, especially when dealing with large datasets.
Elevating the app-building experience
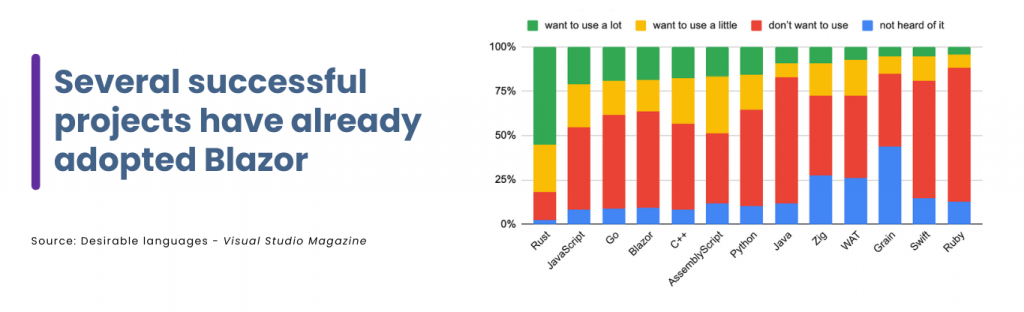
2023 has been a good year for Blazor! On the desirability scale, the Blazor web-dev framework is coming on strong in the report, having climbed from sixth spot in 2021 to fourth this year among several programming frameworks.
We believe in the power of choice, and we believe the flexibility in technology choices provided by including Blazor in FusionChart’s integrations ecosystem enhances the development process, offering a balance between the strengths of C# and .NET and the rich visualization capabilities of FusionCharts. Here are a few reasons why:
Built-in JavaScript interoperability:
Blazor is appealing to C# developers as developers can reuse their existing knowledge on C# to create applications, which means developers can leverage existing well-developed JavaScript packages in Blazor application. One example is data visualization libraries such as FusionCharts.
Smooth Transition from traditional JavaScript stacks:
For organizations that are transitioning from traditional JavaScript-based stacks to Blazor, integrating a familiar JavaScript charting library such as FusionCharts can ease the migration process, allowing developers to adopt Blazor gradually while still benefiting from the familiarity of FusionCharts.
Capitalize on your FusionCharts investment:
If developers or organizations have already invested time and resources into creating or using chart components with FusionCharts, integrating FusionCharts with Blazor allows them to reuse and leverage their existing codebase while adopting Blazor for other parts of the application.
Community support and Ecosystem:
The FusionCharts community actively contributes to the development and improvement of charting capabilities. By integrating FusionCharts with Blazor, developers can tap into a wealth of community knowledge, coupled with extensive training resources that accelerate your learning curve. .
How to Get FusionCharts v3.22 Blazor Integration
Excited to try started with FusionCharts v3.22 Blazor Integration? Choose how you’d like to get started with FusionCharts v3.22:
Unlock the power of data visualization with Blazor integration! Seize the opportunity now and enjoy a 30% discount on you new license — your gateway to creating stunning charts and enriching user experiences.
Helpful links:
Create a Chart in Blazor using FusionCharts
Share Your Thoughts and Feedback
We value your feedback and want to hear about your experience with FusionCharts v3.22. Join the conversation on our community forum or connect with us on social media. Your insights play a crucial role in shaping the future of Fusioncharts.
Thank you for being a part of the FusionCharts community. We’re excited about the possibilities that our new integration unlocks, and we can’t wait to see what you’ll build with it!
Happy charting!
.blog_prompt {
padding: 10px 8px;
background: #f3f3f3;
border-left: 4px solid green;
}