Step aside, wilting roses and predictable chocolates. This Valentine’s Day, ditch the clichés and embrace the magic of data. With FusionCharts, the versatile JavaScript charting library, you can transform cold numbers into captivating love stories that spark genuine connections and leave lasting memories.
Imagine painting a vibrant data portrait of love, relationships, and preferences. Interactive maps unveil the diverse tapestry of love languages across the globe, while heatmaps decipher gift-giving trends, revealing hidden insights to help you find the perfect present. Dive into the fascinating world of modern love by visualizing dating app usage patterns and success rates – a unique window into the ever-evolving landscape of romance.
Step beyond the mundane and paint a picture with data. Imagine interactive charts revealing the diverse landscape of love languages across the globe, or heatmaps depicting the most popular gifts in different regions. Dive into dating data, visualizing usage patterns and success rates with captivating line graphs and pie charts.
Table of Contents
Beyond Clichés: Data-Driven Love Stories
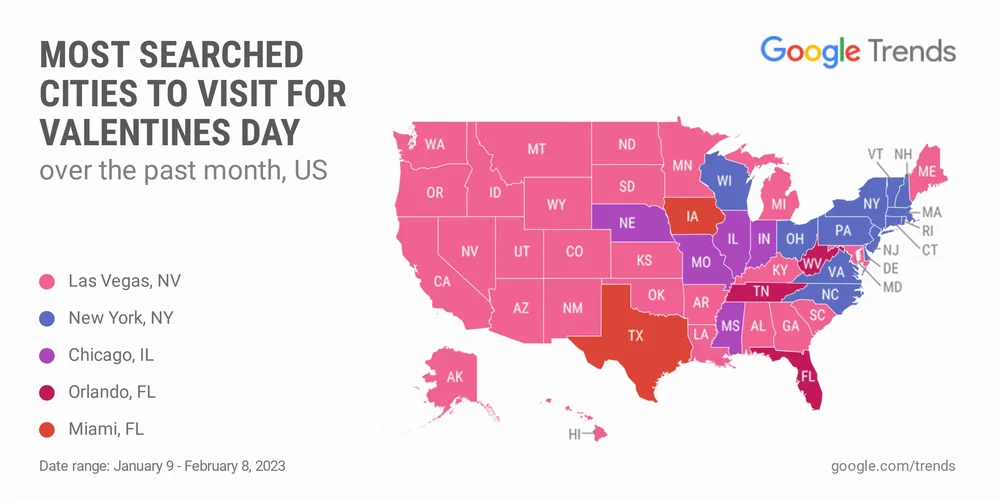
Most searched cities to visit for Valentine’s Day
Choosing a Valentine’s Day getaway isn’t just about a place, it’s about gifting an experience. You’re gifting shared moments, laughter-filled discoveries, and memories that will forever ignite the embers of your love.
Does your heart whisper of cobbled streets, ancient castles, and candlelit dinners under the European sky? Perhaps Venice’s gondolas serenade your soul or the charm of Parisian cafes ignites your wanderlust. Or maybe your adventurous spirit craves something more exotic? Picture yourselves trekking through the vibrant landscapes of Bali, feeling the sand between your toes in the Maldives, or exploring the ancient wonders of Angkor Wat together.
No matter your preference, the magic lies in creating something new, together. Skip the predictable, embrace the extraordinary. This Valentine’s Day, gift yourselves an unforgettable escape to a haven of romance. Whether you yearn for Europe’s cobbled charm or crave exotic adventures, explore new horizons, hand-in-hand.
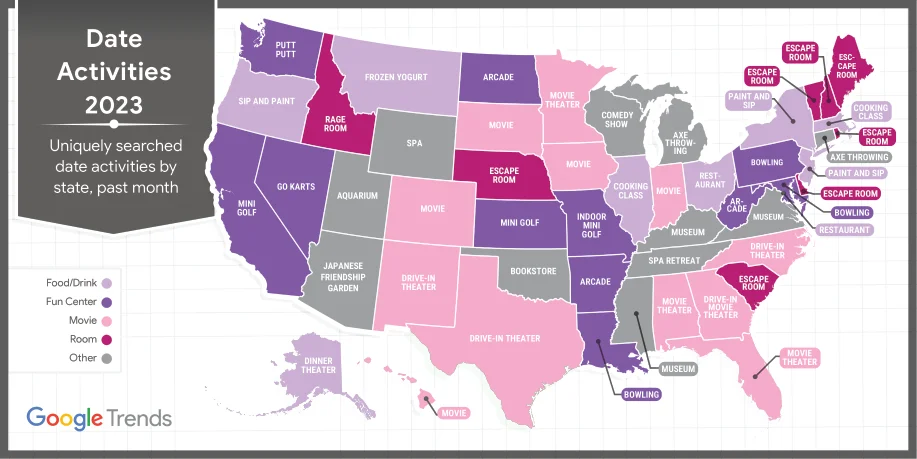
Valentine’s Day Date Activities
Forget candlelit dinners and roses! This year, Americans are craving adventure for their date nights. Searches for “date night ideas” soared, and the top picks might surprise you. Turns out, escaping a locked room (or unleashing your inner rage) is getting hearts racing across the country. Is Idaho channeling some hidden aggression, or are they just onto something unique?
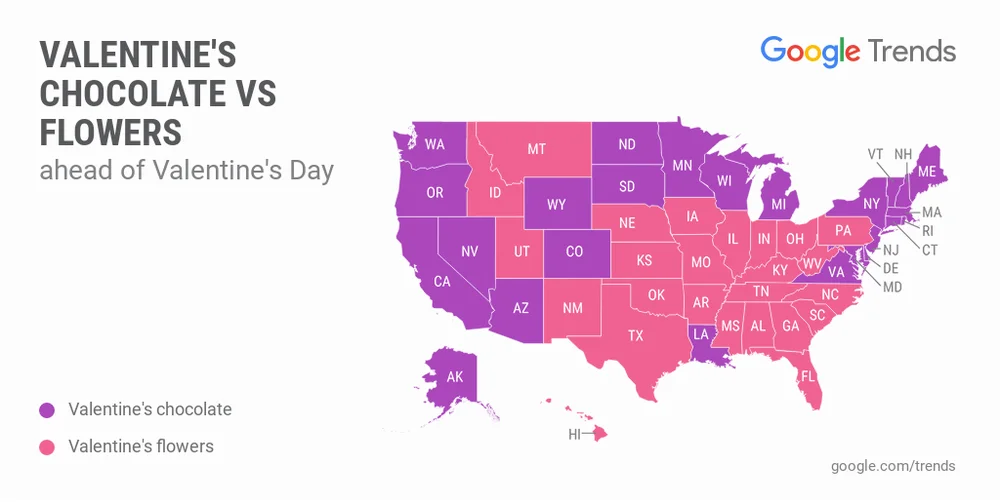
Valentine’s Chocolate vs Flowers
Forget one-size-fits-all romance! While Valentine’s Day sparks love universally, how we express it varies wildly. This analysis of global search trends revealed fascinating differences in gift preferences.
Team “Shower with Sweets“: Look no further than the US! They lead the pack, lavishing their loved ones with chocolates, flowers!
But why choose FusionCharts as your data cupid?
FusionCharts is your love data wingman, offering an array of features to transform your data into an irresistible serenade:
The Interactive Spark: FusionCharts goes beyond static presentations, igniting engagement and exploration. Let your audience delve deeper into your data, uncovering hidden connections and personalized insights. Imagine finding your perfect match based on shared data points – now that’s a truly unique way to make a connection. Craft dynamic narratives with clear labels, annotations, and interactive elements.
Tailoring Love with Customization: Unleash your inner design guru with a palette of love-themed colors and romantic chart types like hearts, roses, and doves. Add subtle animations and transitions for a touch of magic, making your data dance with delight.
Brand your love story: Integrate your brand colors and themes seamlessly, creating a cohesive and visually stunning experience that resonates with your audience. Brand your love story seamlessly by integrating your brand colors and themes, creating a cohesive and visually stunning experience that resonates with your audience.
Tell unique stories: Remember, data is the new language of love, and FusionCharts is your expert translator. Craft a compelling narrative with clear labels, annotations, and interactive elements. Guide your audience on a journey of discovery, revealing the deeper meaning behind your data and igniting their imagination.
Ready to spread the chart love?
Whether you’re a seasoned data whiz or a love story enthusiast, FusionCharts empowers you to create impactful visualizations that go beyond the ordinary. This Valentine’s Day, ditch the clichés and embrace the power of data.
Explore FusionCharts today and discover the endless possibilities for creating chart-tastic love stories this Valentine’s Day. Remember to check out our special Valentine’s Day discounts and resources to get you started!
Remember, data is the new language of love, and FusionCharts is your interpreter. So, go forth, spread the chart love, and make this Valentine’s Day one for the data-driven books!
Additional Resources
Additional Resources
Read → Data visualization assesses the quirks of Valentine’s Day
Read → 4 trends search reveals about Valentine’s Day