In the dynamic world of web development, effective data visualization is a key component for creating compelling user interfaces. JavaScript charting tools play a pivotal role in translating raw data into meaningful insights, and among the myriad options available, FusionCharts and D3.js stand out as powerful contenders. In this comprehensive comparison, we’ll dissect the features, advantages, and drawbacks of both tools to guide you in selecting the perfect charting solution for your web development endeavors.
Table of Contents
Unveiling the Contenders
FusionCharts, known for its user-friendly interface and extensive customization options, goes head-to-head with D3.js, a powerful library celebrated for its flexibility and advanced features. As developers weigh their options for charting tools, understanding the nuances of each becomes imperative. Join us on this exploration as we dissect the strengths, challenges, and unique offerings of FusionCharts and D3.js, providing insights that will guide you in making an informed decision for your next data visualization project.
Whether you’re a seasoned developer seeking the right balance of ease and functionality or an enthusiast eager to navigate the intricate world of JavaScript charting, this showdown aims to unravel the mysteries and complexities, making your decision-making process more straightforward. Let’s dive into the JavaScript Charting Tool Showdown and discover which tool emerges as the champion for your data visualization needs.
Criteria: Ease of Use and Learning Curve
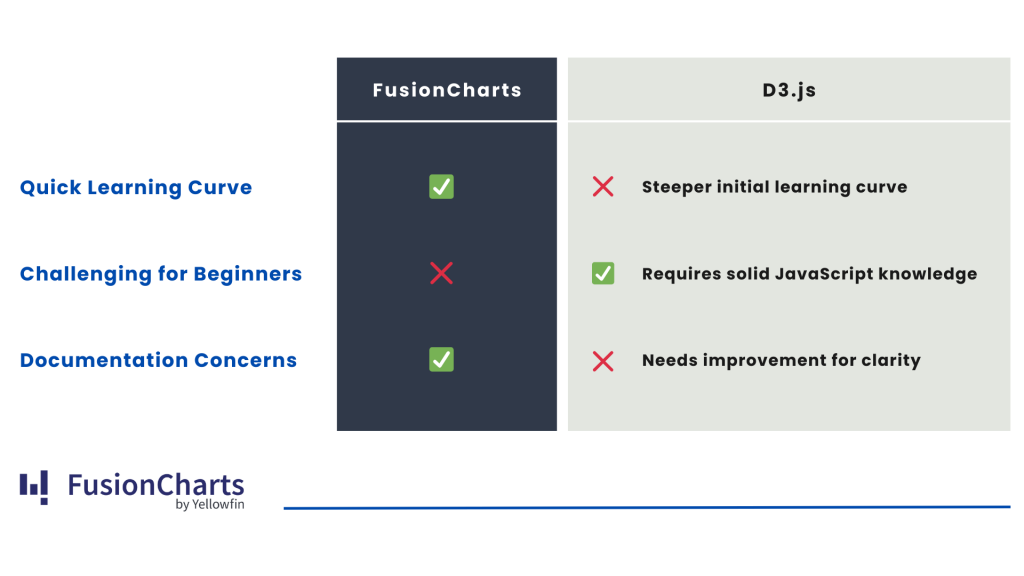
When comparing the ease of use and learning curve for FusionCharts and D3.js, it’s essential to consider user feedback from D3.js practitioners. FusionCharts stands out for its user-friendly interface, offering a swift learning curve for developers. In contrast, D3.js presents a steeper initial learning curve, making it challenging for beginners who need a solid grasp of JavaScript and web development. While D3.js becomes more manageable with experience, users highlight the importance of improved documentation for a smoother learning path.
-
D3.js Learning Curve:
Users have acknowledged that D3.js comes with a steep learning curve. While it may take some time to grasp, once overcome, it becomes easy to reuse across multiple similar problems with little changes.
-
Complex Coding:
D3.js is considered challenging and not suitable for beginners, requiring a solid understanding of JavaScript and web development.
-
Documentation Concerns:
Some users have expressed that the documentation for D3.js could be improved for better clarity and ease of use. This is an aspect that developers should keep in mind when choosing a charting tool.
Criteria: Customization and Flexibility
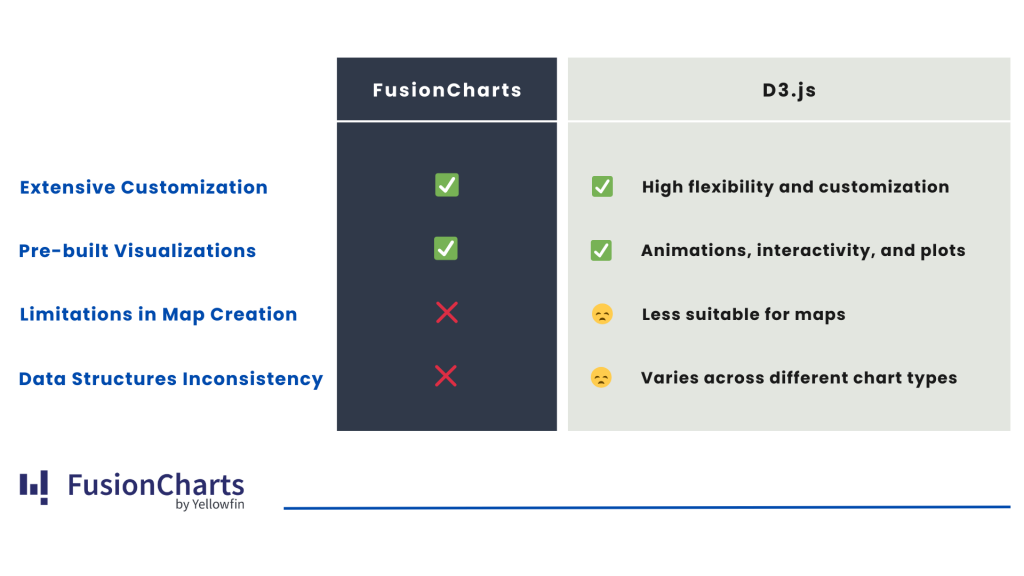
In the realm of customization and flexibility, D3.js has earned both praise and constructive criticism. While FusionCharts excels in customization, providing a diverse range of options and pre-built visualizations. On the other hand, D3.js offers unparalleled flexibility with advanced features like animations and interactivity. However, some users note limitations in map creation, and inconsistencies in data structures across different chart types may require additional processing.
-
Limitations in Map Creation:
Some users find D3.js less suitable for creating maps compared to other visualization tasks.
-
Consistency in Data Structures:
However, some users note a need for more consistency of data structures required for different chart types, leading to extra processing. This is something to consider when evaluating customization options.
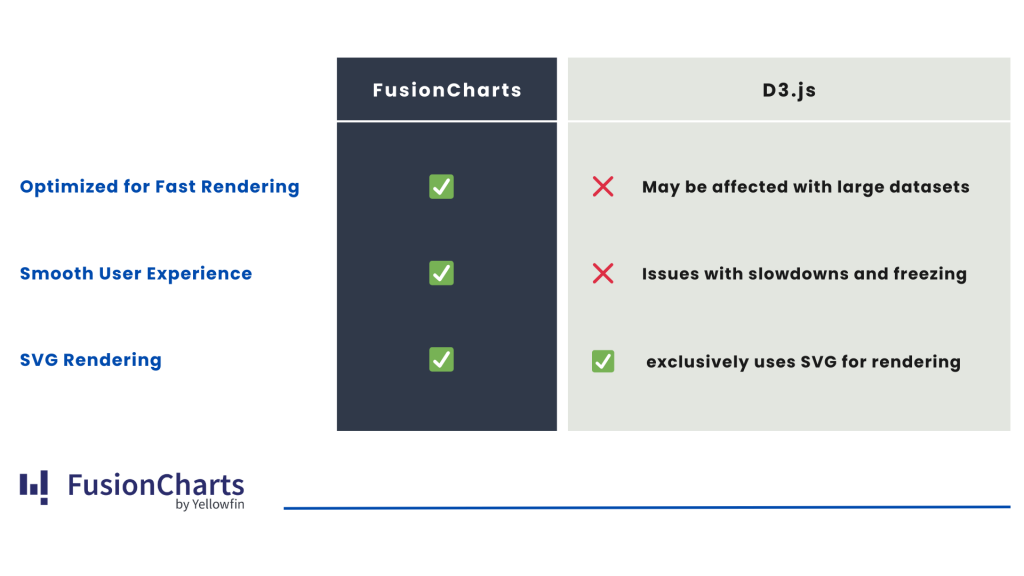
Criteria: Performance and Rendering
Regarding performance and rendering capabilities, FusionCharts is optimized for fast rendering, ensuring a seamless and smooth user experience. D3.js, while powerful, may face challenges with larger datasets and SVG rendering, potentially causing slowdowns and freezing. Developers should carefully consider the scale and requirements of their projects when evaluating the performance aspects of both charting tools.
-
Issues with Large Datasets:
Users caution that D3.js may face challenges when dealing with large datasets, potentially causing slowdowns and freezing. It’s crucial for developers to assess performance requirements based on the project’s scale.
-
SVG Rendering:
D3.js exclusively uses SVG for rendering, offering great resolution and aesthetics. However, users point out that this choice may result in performance issues with large datasets. This factor should be weighed against the benefits of SVG rendering.
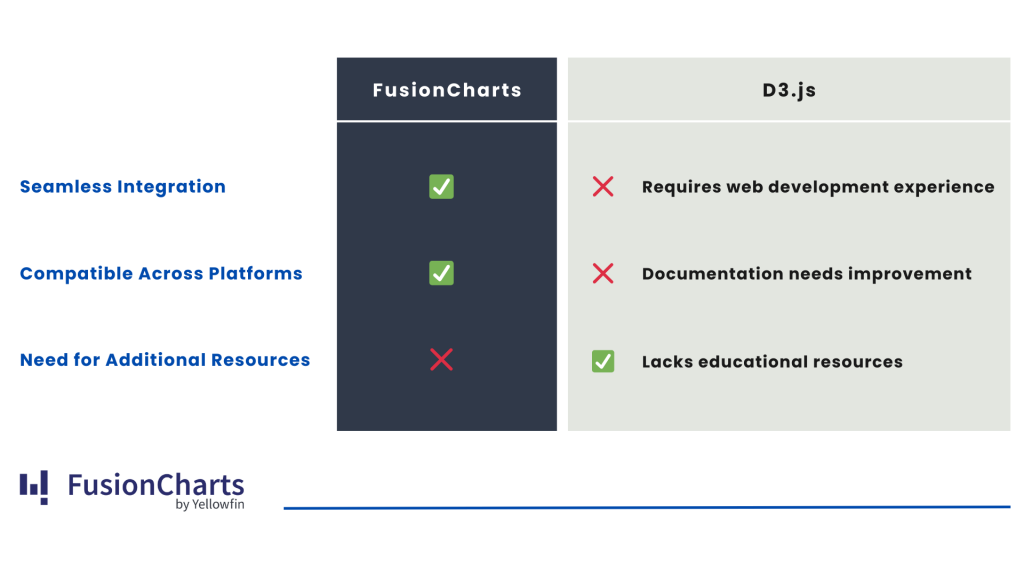
Criteria: Compatibility and Integration
Considering compatibility and integration, FusionCharts seamlessly integrates with various technologies and platforms, providing a user-friendly experience. D3.js, while requiring web development experience, benefits from a strong community. However, users suggest improvements in documentation, and additional educational resources are recommended for developers considering D3.js integration.
-
Seamless integration:
FusionCharts seamlessly integrates with various technologies, providing compatibility across different platforms.
-
Framework adaptability:
compatibility with different frameworks and environments, making it a versatile choice for developers working in diverse ecosystems.
Choose Your Intuitive Charting Ally
In the ever-evolving world of web development, both FusionCharts and D3.js contribute significantly to the rich tapestry of data visualization possibilities. Your decision should align not just with the current needs of your projects but also with your aspirations for future growth and exploration in the captivating domain of JavaScript charting.
For those valuing a smooth learning curve and a quick journey from data to visualization, FusionCharts stands as a reliable ally. Its intuitive interface and seamless integration capabilities across various platforms make it a go-to solution for developers aiming to effortlessly create visually stunning and interactive data representations.
On the other hand, D3.js, despite its steeper learning curve, D3.js enthusiasts benefit from a vibrant community, offering support and resources that can be invaluable for navigating the complexities of integration.
As you navigate the landscape of charting tools, consider FusionCharts for a journey marked by simplicity, versatility, and powerful visualizations.
Happy charting with FusionCharts!
h2{
color: purple;
}
h5{
color: #6957da;
}