FusionCharts vs Chart.js: Which charting library is best for modern dashboards?
Chart.js is good for small projects as it is simple, free, and open-source. But it isn't helpful if you want to scale your website. When it comes to building full-featured dashboards with real-time data, custom interactions, and enterprise-ready features, FusionCharts gives you everything you need. You can even use it for your side projects.

Why choose FusionCharts over Chart.js?

More than just charts
While Chart.js focuses on basic line and bar charts, FusionCharts delivers 100+ advanced visualizations like Gantt, Heatmap, Marimekko, and 2000+ maps — built for real-world business dashboards.
Built for all type of developers
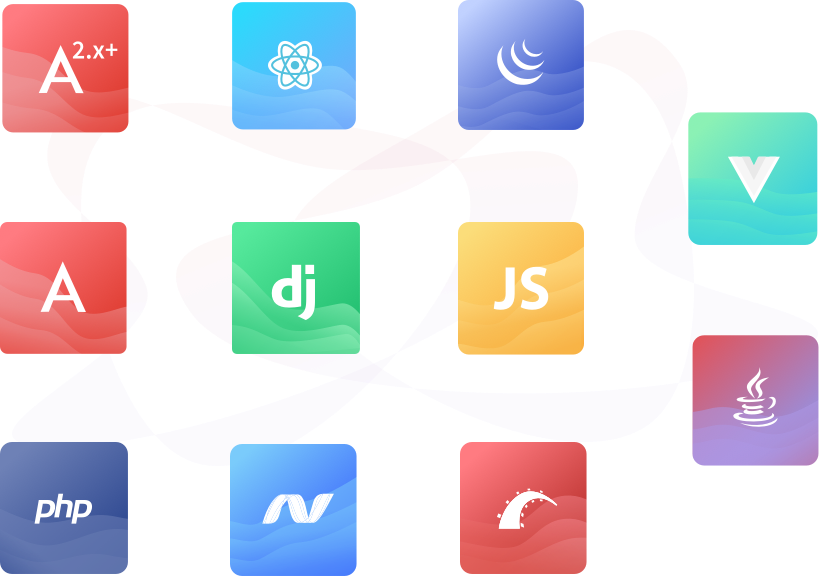
Chart.js is lightweight, doesn’t support other programming languages but FusionCharts is compatible with everything programming language and framework. Plug directly into React, Vue, Angular, .NET, Java, Python and export everything with ease.
Dashboard-ready features
Time-series charts, export tools, drill-downs, real-time data streaming. FusionCharts is built to power full-fledged BI tools, not just static reports.
Exhaustive and in-depth documentation to build your dashboards quickly
Documentation is key to get the correct implementation quickly. FusionCharts offers not only API references but also easy-to-follow tutorials for every chart and every configuration. All these tutorials are also present in over 10+ frameworks and languages such as React, Vue, Svelte, Ruby on Rails, Django, etc.
Official plugins for back-end and front-end for better integration
Apart from providing official integrations for popular frameworks like React, Angular, and Vue.js, we also offer integrations for Ember, Java, Rails, and jQuery so that you can integrate FusionCharts into your project smoothly.
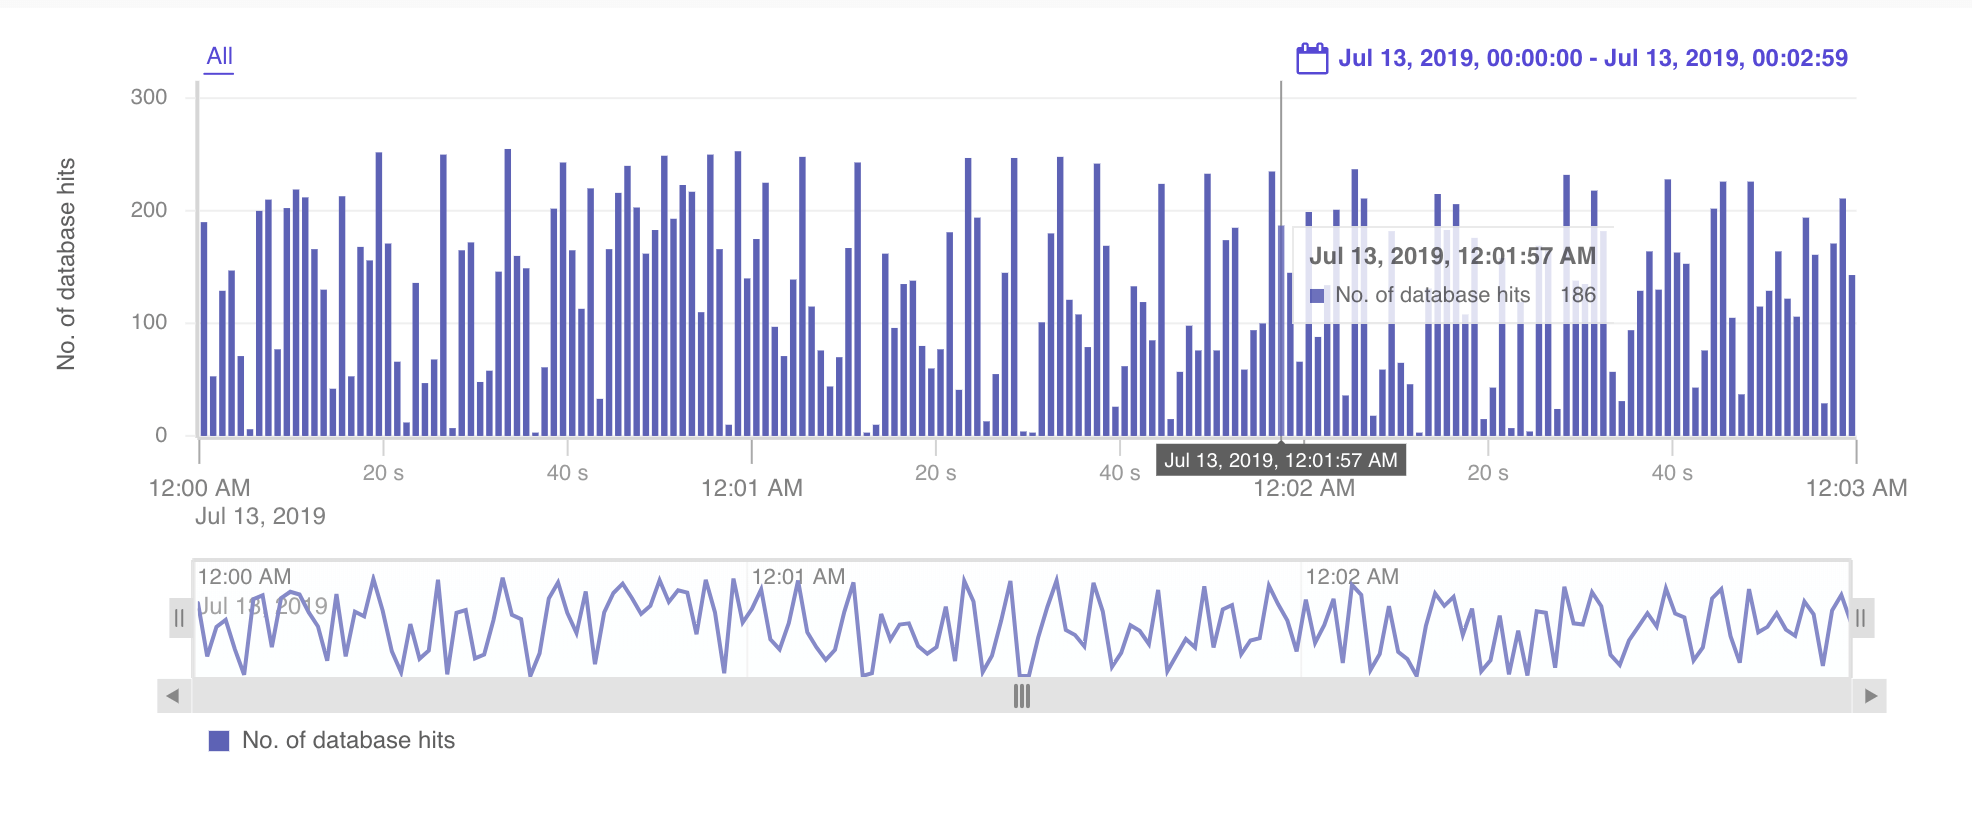
Handle millions of data points with ease
Whether you are handling millions of data points from IoT sensors or financial dashboards, FusionTime will help you nail them with ease. FusionTime provides ways to customize data plot, Date Range Selector, Time Navigator along with handling missing data as well.
FusionCharts vs Chart.js: Compare offerings, performance, and developer experience
| Feature | FusionCharts | Chart.js | What This Means for You |
|---|---|---|---|
| Chart capabilities | 100+ charts, widgets, gauges, maps, real-time charts | Basic line, bar, pie, radar, and a few others | Go beyond basics — build dashboards, not just charts |
| Interactivity | Advanced drill-downs, hover layers, tooltips, filters | Limited interactivity | Better UX and data storytelling |
| Framework support | Native support for React, Vue, Angular, jQuery, .NET, Java | Manual integration via wrappers | Save dev time and reduce boilerplate |
| Time-series charts | FusionTime built-in for zoom, pan, range, trendlines | No dedicated time-series module | Perfect for fintech, IoT, or analytics products |
| Exporting | One-click export + CLI (FusionExport), PDF/PNG/SVG | Requires plugins and manual handling | Easily generate reports and exports at scale |
| Customization | Theming, annotations, custom data formats, event tracking | Basic styling and configuration | Match your design system effortlessly |
| Learning curve | Clean docs, live examples, 1:1 support, community Slack | Simple but lacks deep guidance for advanced use cases | Grow fast and get unstuck easily |