Box and Whisker Plot

Box and Whisker Plot
Have you ever looked at a massive dataset and felt overwhelmed by the numbers? Box and whisker plots come to the rescue! Now, you might want to know about the secrets of this powerful graphical tool. So, we're here to help you!We'll delve into interpreting box and whisker plot, explore their practical uses, and even provide examples to solidify your understanding. So, buckle up and get ready to transform your data analysis skills!
What is a Box and Whisker plot
A box and whisker plot, also sometimes called a boxplot, is a way to visually understand how a set of data is spread out. It uses a box to represent the middle half of the data, with a line in the middle showing the median or middle value. The whiskers extend out from the box to show the spread of the rest of the data. This makes it easy to see how much variation there is in the data and whether there are any outliers, which are data points that fall far outside the typical range.In addition, a box and whisker plot is helpful because it can quickly show you a lot of information about a data set in a single image. They are especially good for comparing data sets from different groups, as you can see how the spread and center of the data differ between the groups.
What Do Box and Whisker Plots Show
Box and whisker plots are a type of graph used to visualize the distribution of data. They offer a quick and informative way to understand several key aspects of your data set. So, let's see what box and whisker plots show:- Spread of the data: The box shows middle 50% of the data, with the median value dividing the box in half. The whiskers extend from the box to show the remaining data points, indicating how spread out the data is.
- Center of the data: The median, represented by a line in the middle of the box, shows the "middle" value of the data set.
- Skewness: By looking at the symmetry of the box and whiskers, you can see if the data is skewed (lopsided) towards one side or if it's relatively symmetrical.
- Outliers: Points that fall outside a certain range from the rest of the data are considered box and whisker plot outliers and are typically plotted individually beyond the whiskers.
Additionally, box and whisker plots are particularly useful for comparing data sets side-by-side. By placing multiple boxplots on the same graph, you can easily see how the data distributions differ between groups.
How to Interpret Box and Whisker Plots
Box plots are a great way to understand a data set's spread and key features in a single image. Here's how to interpret box plot and whisker plot:The box itself shows the middle 50% of the data. The line in the middle of the box shows the median, which is the center value when all the data points are lined up from least to greatest. The edges of the box mark the upper and lower quartiles. The quartiles divide the data into fourths, with the median splitting it exactly in half.
The lines extending from the box, called whiskers, show the range of the rest of the data. Ideally, the whiskers extend to the maximum and minimum values, but they can be trimmed to a certain distance from the quartiles to avoid extreme outliers overly influencing the plot's scale. Any data points falling outside the whiskers are typically marked as outliers.
By looking at the box and whisker plot, you can quickly see how spread out the data is, whether there's a skew towards one side (positive or negative), and if there are any outliers that might require further investigation.
How Do You Summarize a Box and Whisker plot?
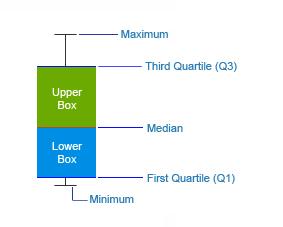
The Box & Whisker chart displays the spread and skewness in a batch of data through its five-number summary: minimum, maximum, median, upper and lower quartiles. Let’s understand them:- Minimum: The smallest data point in the dataset, excluding outliers.
- Maximum: The largest data point in the dataset, excluding outliers.
- Median: The middle value that divides the dataset into two equal halves.
- Upper Quartile (Q3): The median of the upper half of the dataset, representing the 75th percentile.
- Lower Quartile (Q1): The median of the lower half of the dataset, representing the 25th percentile.
Positives of Box and Whisker Charts
It’s time to understand the goods of box and whisker plot:- For a quick understanding of the distribution of a dataset
- To know whether a distribution is skewed or not
- To find out unusual observations/errors in the data set
Box and whisker plots are also very useful when large numbers of observations are involved and when two or more data sets are being compared.
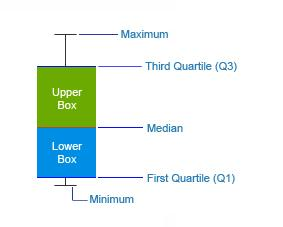
The Box and Whisker consists of two parts—the main body called the Box and the thin vertical lines coming out of the Box called Whiskers .
Check out live examples of Box and Whisker Chart in our charts gallery and JSFiddle gallery.
When to Use Box and Whisker Plot
Now you know the box and whisker plot mean; it's time to learn the use of box and whisker plot. Here are the ideal situations for using a box and whisker plot, also known as a box plot:- Comparing Distributions: Box plots are particularly useful when you want to compare the distributions of data between multiple groups. They can quickly show you if there are differences in the center, spread, or presence of outliers between the groups.
- Identifying Outliers: Box plots can easily highlight outliers in your data. Outliers are data points that fall outside a certain range from the rest of the data. By seeing if there are any points extending far from the whiskers, you can identify potential outliers that might require further investigation.
- Understanding Spread: Box plots effectively show the spread of your data. The size of the box itself represents the interquartile range (IQR), which indicates the middle 50% of the data. This helps you understand how much variability there is within the data set.
Overall, understanding box and whisker plots are a great way to get a quick and clear picture of the distribution of your data, especially when you have multiple groups to compare. They are efficient for spotting outliers and understanding the spread of the data.
Box and Whisker Plot Examples
We’ve mentioned below the box and whisker plot examples:Let's say 7 students get the following scores in 2 subjects:
| Student | Ann | Jacob | Susan | Rose | Tom | Peter | Kate |
|---|---|---|---|---|---|---|---|
| Maths | 35 | 78 | 91 | 42 | 56 | 66 | 71 |
| Physics | 85 | 68 | 70 | 30 | 78 | 83 | 45 |
You have to visualize the distribution of their scores. The Box and Whisker chart can come in handy in such scenarios!
This approach allows for a quick and informative way to understand student performance across different subjects.
Constructing a Box and Whisker chart:
To understand how a Box and Whisker chart is constructed, we have to first arrange our data in ascending order.
The ordered data sets are :
| Student | Ann | Jacob | Susan | Rose | Tom | Peter | Kate |
|---|---|---|---|---|---|---|---|
| Scores in Maths | 35 | 45 | 56 | 66 | 71 | 78 | 91 |
| Scores in Physics | 30 | 45 | 68 | 70 | 78 | 83 | 85 |
Scores in Maths: 35, 42, 56, 66, 71, 78, 91
Scores in Physics: 30, 45, 68, 70, 78, 83, 85
Now let us find the median, the first (lower) quartile and the third (upper) quartile
The median is the point at which there are an equal number of data points whose values lie above and below the median value. [It is considered to be a better measurement of central tendency (most probable occurrence) in case of skewed distribution.]
In the example above,
Scores in Maths: 35, 42, 56, 66, 71, 78, 91
Scores in Physics: 30, 45, 68, 70, 78, 83, 85 66 and 70 are the median values in Maths and Physics respectively (there are 3 data points both above and below these values).
The First (Lower) Quartile is the midpoint of the lower half of our data.
Lower half of scores in Maths (in Bold): 35, 42, 56, 66, 71, 78, 91
Lower half of scores in Physics (in Bold): 30, 45, 68, 70, 78, 83, 85
42 and 45 are the first quartiles in Maths and Physics respectively (there is 1 data point both above and below)
The Third (Upper) Quartile is the midpoint of the upper half of our data.
Upper half of scores in Maths (in Bold): 35, 42, 56, 66, 71, 78, 91
Upper half of scores in Physics (in Bold): 30, 45, 68, 70, 78, 83, 85
78 and 83 are the third quartiles in Maths and Physics respectively (there is 1 data point both above and below).
A quick summary of the values for our Box and Whisker chart:
| Maths | Physics |
|---|---|
| Median= 66 | Median= 70 |
| Lower quartile= 42 | Lower quartile= 45 |
| Upper quartile= 78 | Upper quartile= 83 |
| Minimum value= 35 | Minimum value= 30 |
| Maximum value= 91 | Maximum value= 85 |
Now let’s see how these values translate into our Box and Whisker chart:
The first quartile forms the bottom and the third quartile forms the top of the Box. The Whiskers connect the minimum and the maximum values to the Box.
In addition to showing median, first and third quartile and maximum and minimum values, the Box and Whisker chart is also used to depict Mean, Standard Deviation, Mean Deviation and Quartile Deviation.
Depicting Mean in Box and Whisker chart: Analysis of Flight Departure Delays
Let us assume there were 5 Flights leaving an airport and data was collected for a period of 5 days. To analyze the delays, you can use a boxplot calculator to visualize the mean and distribution of the departure delays effectively.
DEPARTURE DELAYS (in mins)
| Mon | Tue | Wed | Thu | Fri | |
|---|---|---|---|---|---|
| Flight 1 | 5 min | 1 min | 10 min | 1 min | 6 min |
| Flight 2 | 0 min | 6 min | 2 min | 10 min | 5 min |
| Flight 3 | 1 min | 3 min | 5 min | 2 min | 2 min |
| Flight 4 | 9 min | 10 min | 3 min | 2 min | 1 min |
| Flight 5 | 1 min | 2 min | 3 min | 6 min | 4 min |
The resulting Box and Whisker chart from this data looks like:
Note that in addition to details like median, quartiles, maximum and minimum values, the chart also shows the mean(average) values (triangular icon),giving an idea of the average delay per day in flight departures.
Box and Whisker charts find their application in Statistical Analysis, Scientific Analysis, Test Results Analysis, Marketing Analysis, Networking Data Analysis, Analytics and General Analysis
Check out some more examples of the Box and Whisker chart here.
Conclusion
Box and whisker plots are a powerful tool for visually understanding the distribution of data. They offer a quick and informative way to see the spread of the data, identify outliers, and compare data sets from different groups. By understanding the different elements of a box and whisker plot, you can gain valuable insights into your data and make better decisions.


Frequently Asked Questions
How do we analyze the box and whisker plots?
Focus on the box (middle 50% of data) and whiskers (spread). A higher median in one box means that the group generally plays longer. Far-out whiskers show potential outliers in each group.How to tell if a box plot is skewed?
See if the median line is closer to one side of the box. If it's way off-center, the data is skewed towards that side (e.g., more short times or more long times).
How to calculate the box and whisker plot?
You don't need a fancy boxplot calculator. Order your data, find the five-number summary, and plot the box, whiskers, and outliers accordingly.What is a real life example of a box and whisker plot?
A real-life example of a box and whisker plot is used in education to display students' test scores. It shows the minimum, first quartile, median, third quartile, and maximum scores, helping to visualize the spread and central tendency of the data, as well as identify any outliers.