FusionCharts Suite XT is a straightforward JavaScript charting library that can be integrated into virtually any framework, programming language, or application that generates an Interactive Graph. VB.NET is a well-known object-oriented programming language based on the.NET framework.
For rendering charts created using FusionCharts in VB.NET and Windows-based applications, we can use one of the following three methods:
- Rendering charts by generating the HTML code as a string and passing it to the WebBrowser control.
- Rendering charts by navigating to a local HTML file that contains the chart object.
- Rendering charts by including the FusionCharts ASP.NET server-side wrapper in the project.
In this post, we’ll cover up a tutorial that talks about integrating FusionCharts Suite XT with VB.NET and Windows-based form applications.
Table of Contents
Requirements
We need the following applications installed before rendering FusionCharts in VB.NET and Windows-based applications:
- Visual Studio IDE and .NET Framework [Download Link]
- FusionCharts Suite XT [Download Link]
Method 1: Rendering Charts by Passing the HTML String to the WebBrowser Control
Steps
- Open Visual Studio. From the File menu, select New > Project .
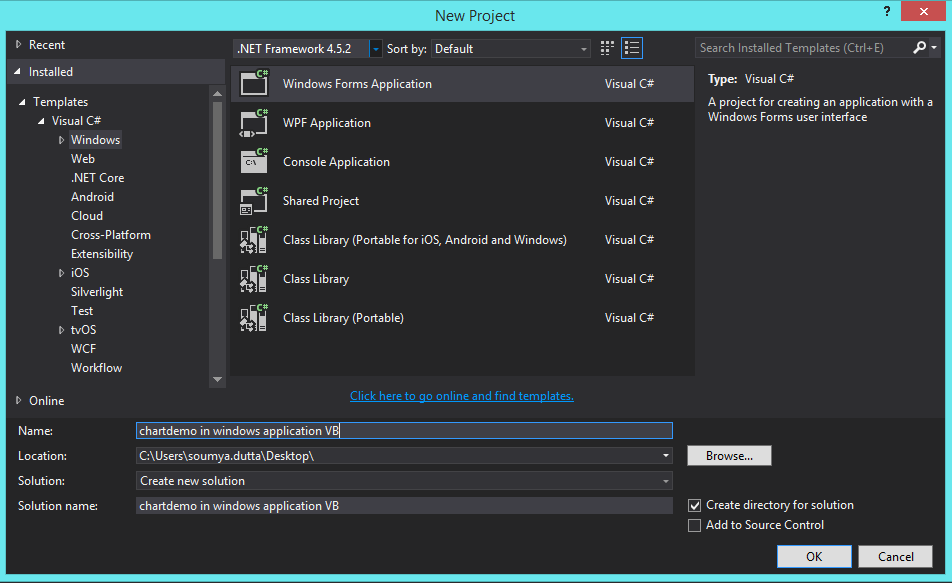
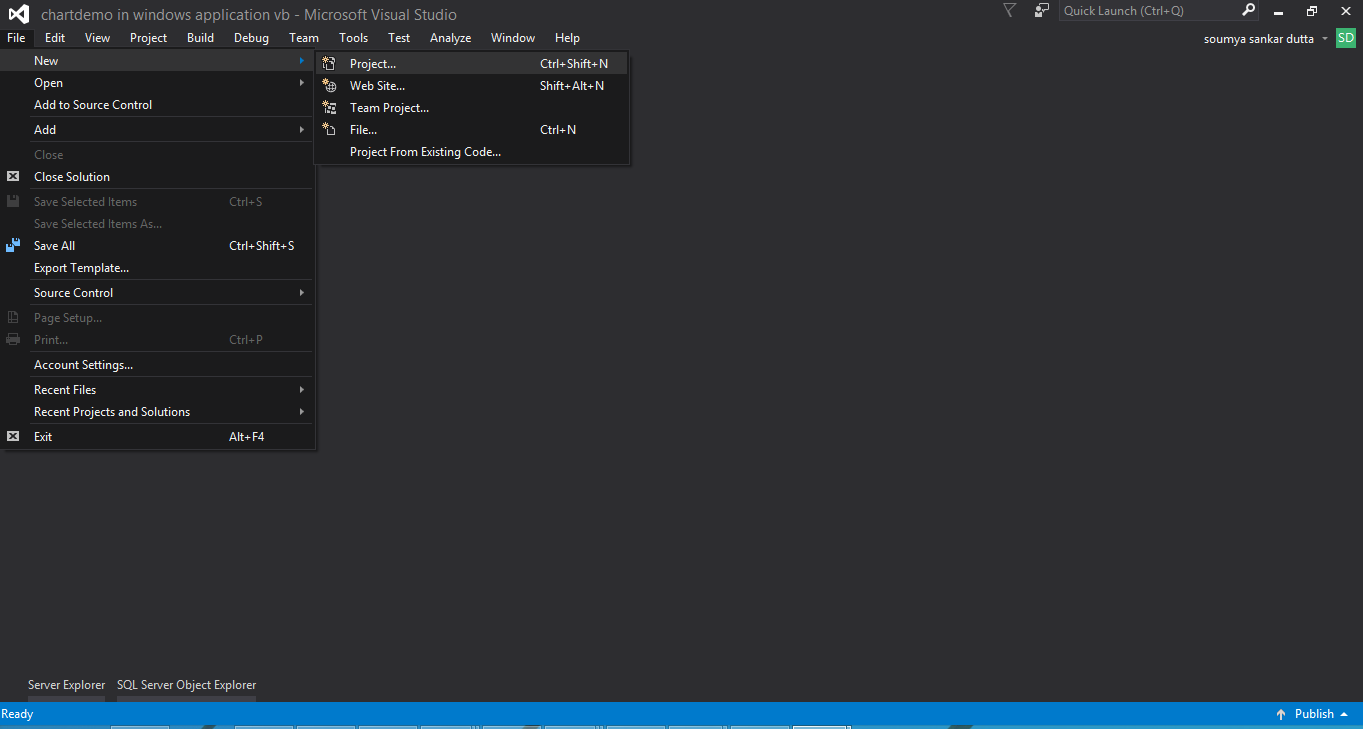 The New Project dialog box opens.
 - From Installed > Templates , select Windows Forms Application , as shown in the image below:
 A form, with the default name Form1.vb, opens.
 - Press F4 to open the Properties window.
Set the Text property to Rendering FusionCharts, as shown in the image below:
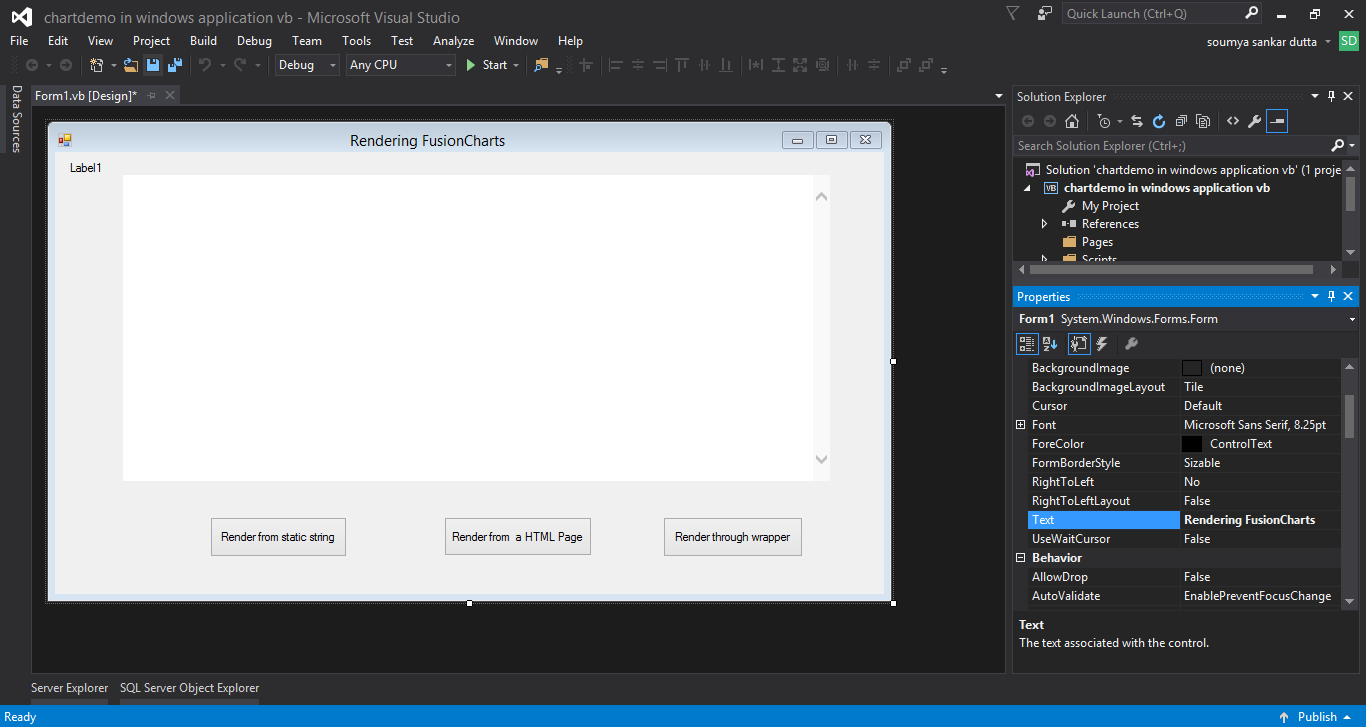 The Text property is used to set the form heading.
 - Open the Toolbox.
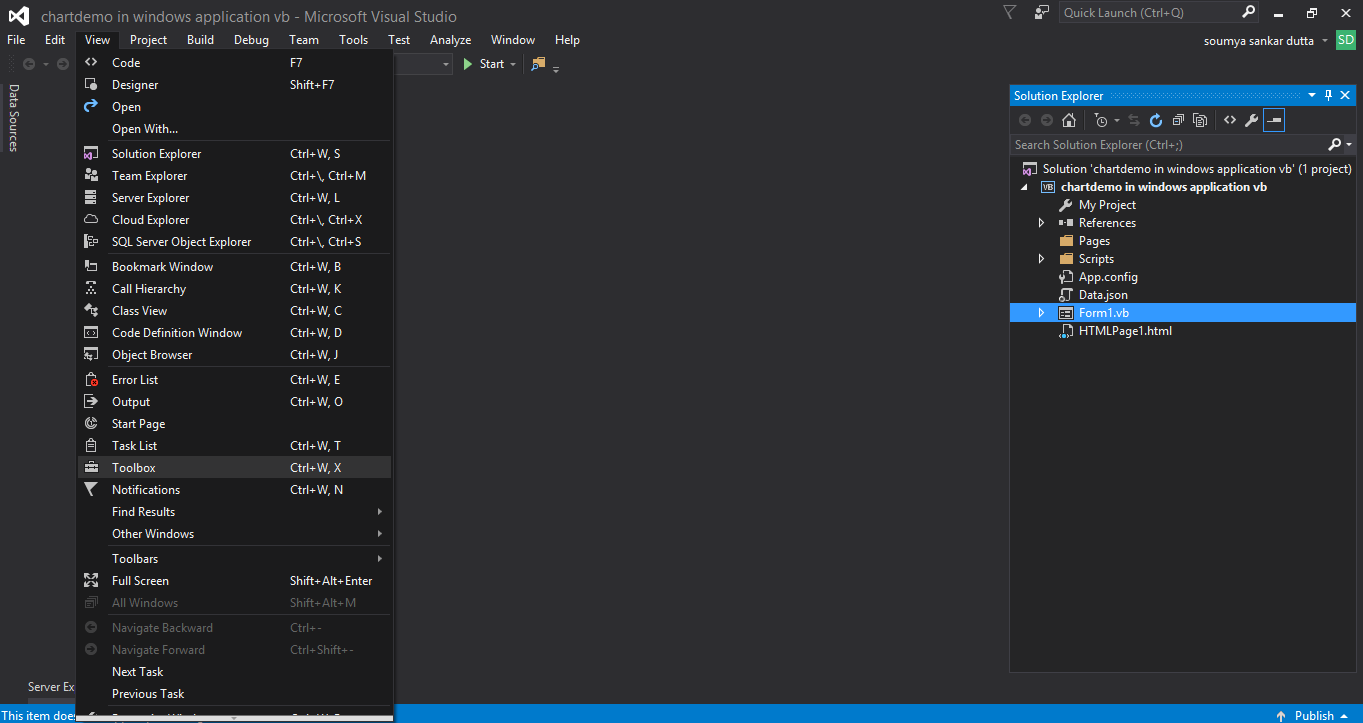
- From the Toolbox , drag the WebBrowser control and drop it on the form.
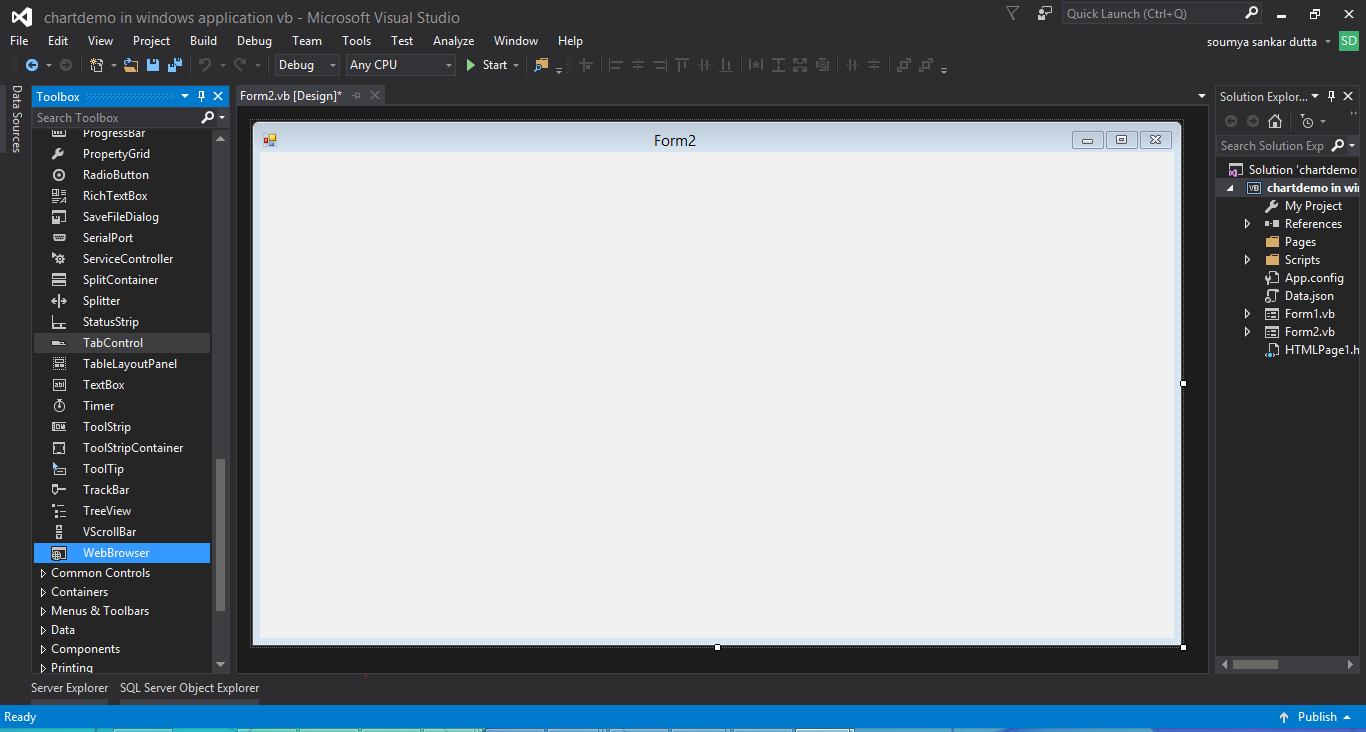
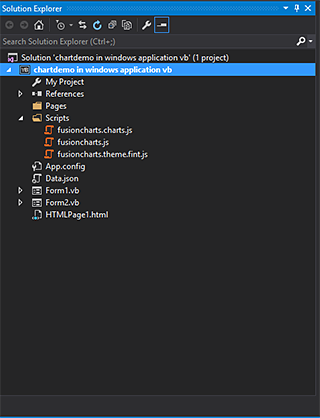
- Add a new folder in the project hierarchy and name it Scripts.
Copy the fusioncharts.js and fusioncharts.charts.js files and paste them into the Scripts folder.
- Open Form1.vb and place the following code within the Load event handler. The code given below is the complete HTML source that will be stored in the StringBuilder variable and passed to the WebBrowser control.
dim html As New StringBuilder html.Append("") html.Append("") html.Append("") html.AppendFormat("", Application.StartupPath.Replace("\\", "/")) html.Append("") html.Append("FusionCharts.ready(function () {") html.Append("var revenueChart = new FusionCharts({") html.Append("type: 'column2d',") html.Append("renderAt: 'chart-container',") html.Append("width: '500',") html.Append("height: '200',") html.Append("dataFormat: 'xml',") html.Append("dataSource: "" <chart caption='Monthly' xAxisName='Month' yAxisName='Revenue' numberPrefix='$' showValues='0'><set label='Jan' value='420000' /><set label='Feb' value='910000' /><set label='Mar' value='720000' /><set label='Apr' value='550000' /><set label='May' value='810000' /><set label='Jun' value='510000' /><set label='Jul' value='680000' /><set label='Aug' value='620000' /><set label='Sep' value='610000' /><set label='Oct' value='490000' /><set label='Nov' value='530000' /><set label='Dec' value='330000' /></chart> "" ") html.Append("});") html.Append("revenueChart.render();") html.Append("});") html.Append("") html.Append("") html.Append("") html.Append("<div id='chart-container' align='center'></div>") html.Append("") html.Append("") WebBrowser1.DocumentText = html.ToString() - Run the application. Your output should look as shown in the image below:

Method 2: Rendering Charts by Navigating to a Local HTML File
Steps
- Create an HTML file in the root folder of the project and name it HTMLPage1.html.

- Copy the following code in the HTMLPage1.html file:
<!DOCTYPE html> <html lang="en" xmlns="https://www.w3.org/1999/xhtml"> <head> <meta charset="utf-8" /> <title>Rendering FusionCharts</title> <script src="https://static.fusioncharts.com/code/latest/fusioncharts.js"></script> <script> FusionCharts.ready(function () { var cSatScoreChart = new FusionCharts({ type: 'angulargauge', renderAt: 'chart-container', width: '400', height: '300', dataFormat: 'json', dataSource: { "chart": { "caption": "Average Customer Satisfaction Score", "subcaption": "Last year vs Current year", "lowerLimit": "0", "upperLimit": "100", "gaugeFillMix": "{dark-40},{light-40},{dark-20}", "theme": "fint", "majorTMAlpha": "0", "minorTMAlpha": "0" }, "colorRange": { "color": [ { "minValue": "0", "maxValue": "50", "code": "#e44a00" }, { "minValue": "50", "maxValue": "75", "code": "#f8bd19" }, { "minValue": "75", "maxValue": "100", "code": "#6baa01" } ] }, "dials": { "dial": [ { "value": "78", "showValue": "1", "tooltext": "Current year's average : $value", "rearExtension": "15" } ] } } }).render(); }); </script> </head> <body> <div id="chart-container">FusionCharts will render here</div> </body> </html> - Add the code given below in the Load event handler of the form:
WebBrowser1.Navigate(AppDomain.CurrentDomain.BaseDirectory.Replace("bin\Debug\", "HTMLPage1.html")) - Run the application. Your output should look as shown in the image below:

Method 3: Rendering Charts Using the FusionCharts ASP.NET Wrapper
Steps
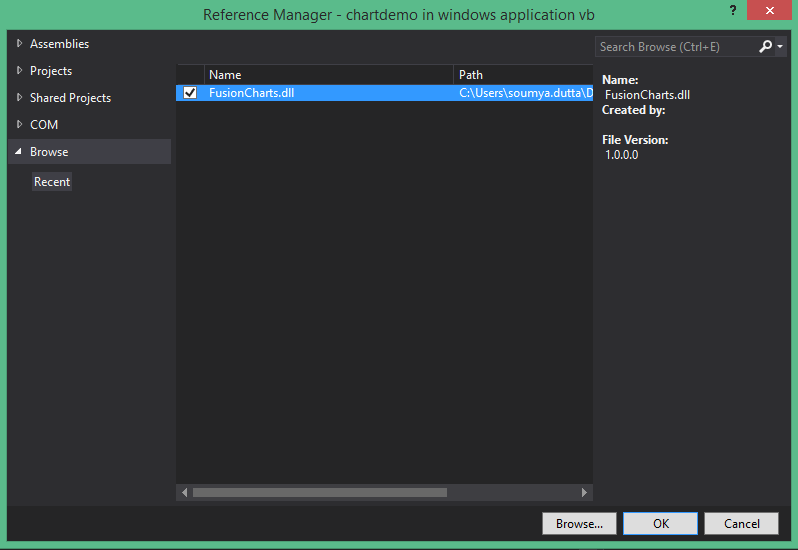
- Add a reference of the fusioncharts.dll file to the project to include the FusionCharts ASP.NET wrapper.
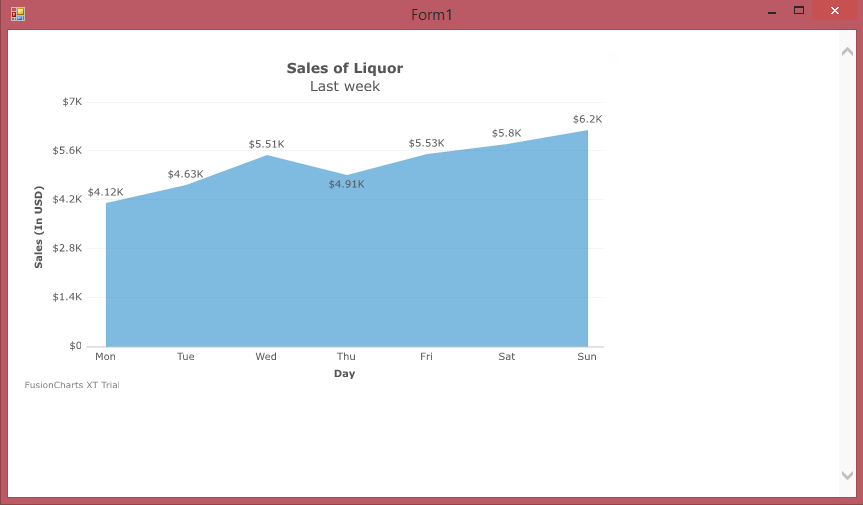
- Copy the code given below in the Load event handler of the form:
Imports System.Text Imports FusionCharts.Charts Public Class Form1 Private Sub Form1_Load(sender As Object, e As EventArgs) Handles MyBase.Load Dim Data As String Data = "<chart caption='Sales of Liquor' subcaption='Last week' xaxisname='Day' yaxisname='Sales (In USD)' numberprefix='$' palettecolors='#0075c2' bgcolor='#ffffff' showborder='0' showcanvasborder='0' plotborderalpha='10' useplotgradientcolor='0' plotfillalpha='50' showxaxisline='1' axislinealpha='25' divlinealpha='10' showvalues='1' showalternatehgridcolor='0' captionfontsize='14' subcaptionfontsize='14' subcaptionfontbold='0' tooltipcolor='#ffffff' tooltipborderthickness='0' tooltipbgcolor='#000000' tooltipbgalpha='80' tooltipborderradius='2' tooltippadding='5'><set label='Mon' value='4123' /><set label='Tue' value='4633' /><set label='Wed' value='5507' /><set label='Thu' value='4910' /><set label='Fri' value='5529' /><set label='Sat' value='5803' /><set label='Sun' value='6202' /></chart>" Dim factoryOutput As New Chart("area2d", "myChart", "600", "350", "xml", Data) Dim Total As New StringBuilder Total.Append("<html xmlns='https://www.w3.org/1999/xhtml'>") Total.Append("<head>") Total.Append("<meta http-equiv='Content-Type' content='text/html; charset=UTF-8' />") Total.AppendFormat("<script type='text/javascript' src='https://static.fusioncharts.com/code/latest/fusioncharts.js?cacheBust=8232'></script>", Application.StartupPath.Replace("\\", "/")) Total.Append("<body>") Dim chartdata As String chartdata = factoryOutput.Render() Total.Append(chartdata) Total.Append("</body>") Total.Append("</html>") WebBrowser1.DocumentText = Total.ToString() End Sub End Class - Run the application. Your output should look as shown in the image below:
If you find any difficulty in rendering the chart or you see any error in your code, click here to download the complete source code of the sample project we have created for this tutorial.
Was There a Problem Rendering the Charts?
In case something went wrong, and you are unable to see the chart, check for the following:
- The chart ID should be unique for all charts rendered on the same page. Otherwise, it will result in a JavaScript error.
- If the chart does not show up, check if the fusioncharts.js and FusionCharts wrapper FusionCharts.java were loaded. Also, check if the path to the fusioncharts.js and the FusionCharts.java files is correct and whether the files exist in that location.


john
June 8, 2018, 12:21 amHi,
I’m trying to use the real-time line chart in vb.net. How can I get a reference to the chart in order to send updates.
Thanks,
John