
Graphs are common in a business environment because they enable us to efficiently represent data. They help us uncover and effectively present key insights to an audience. As a result, React, a popular development tool supports a variety of Graph libraries. Using these libraries, you can conveniently build graphs for your web application. However, not all the standard graphs are to provide the ideal visualization, making it difficult to develop a successful React graph. This begs the question — Is there a way to fix this issue and build a fabulous React graph? What are the steps? In this post, you will find all the details.
Table of Contents
What is React?
React is an open-source JavaScript framework for front-end development. It allows you to create reusable components. As a result, you can quickly build interactive user interfaces. React also enables you to load a massive amount of data without reloading the page. It is a fast, simple, and scalable solution. It’s also a great choice for building large web applications that demand high-performance.
Why should I use React?
Easy to Learn
React has an easy learning curve, and you can get started with it quickly. If you have a basic knowledge of programming and HTML and CSS, you can learn React quickly. Even if you are shifting from other frameworks, including Angular, it won’t take you long to get familiar with it and start building React graphs.
Support for Reusable Components
In React, web applications are comprised of components, which are reusable bits of code. They let you break up the user interface into several small pieces you can reuse in other parts of your application. In React, the pieces are isolated, and a change in one component doesn’t affect the others. This helps you conveniently build and update your web application.
Allows You to Update the UI Quickly
DOM stands for Document Object Model. It is an interface that represents HTML and XML code using trees. Every time a change is made to the HTML code, the DOM tree has to be rendered again. The process is time-consuming and inefficient. While working on graphs, you can’t quickly update the UI to efficiently track the real-time data.
To solve this issue, React uses Virtual DOMs to create a copy of the DOM. Whenever a change occurs, it analyzes and pinpoints the exact tree nodes and components affected. As a result, it can easily figure out the optimal way to update the UI. You supply the data stream via API, and the Virtual DOMs handle the rest. This, in turn, allows you to quickly update your React graph with real-time data.
Large Community
React has a massive community of active developers on Stack Overflow. There’s also a chat community called Reactiflux specifically made for coders using the framework. If you get stuck building React graphs, you will always find a helping hand there. The developers regularly create new solutions and tools for the framework. The framework is not going to die anytime soon.
How can I Easily Develop React Graphs?
You can easily develop React graphs with FusionCharts. It is the most comprehensive JavaScript library for interactive and responsive charts. FusionCharts allows you to effortlessly build beautiful graphs. All you have to do is add a few lines of code to your web application.
Why should You Use FusionCharts?
- Provides numerous graph examples with source code
- Offers comprehensive documentation to help you effortlessly understand all the features
- Gives you access to a huge collection of graphs for effectively visualizing the data
- Provides regular updates and bug fixes
- Offers personalized support for quickly fixing technical issues
What are the Steps for Developing a Successful React Graph with FusionCharts?
FusionCharts has made it very easy to build beautiful React graphs. Here is an example:
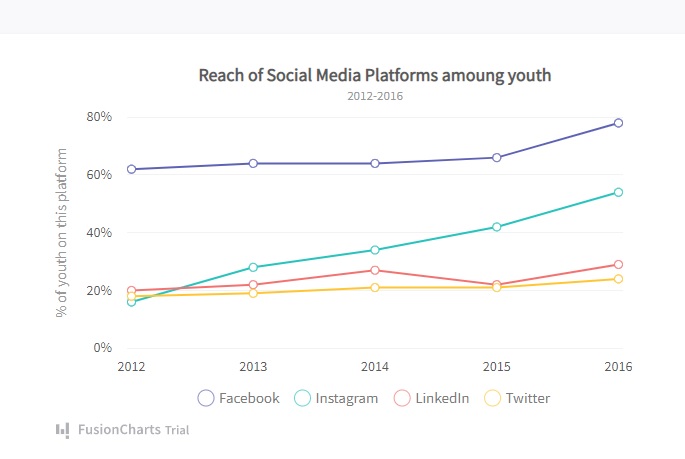
As you can see, it’s a line graph containing multiple series. It represents data on social media platforms’ reach among youths. To create this graph, you need to follow these 3 simple steps:
1. First, you have to import all the required libraries, including FusionCharts, charts, and ReactFusionCharts. You also have to resolve the chart dependency.
import FusionCharts from "fusioncharts";
import charts from "fusioncharts/fusioncharts.charts";
import ReactFusioncharts from "react-fusioncharts";

// Resolves charts dependancy
charts(FusionCharts);
2. Next, you have to add the data source.
const dataSource = {
  chart: {
    caption: "Reach of Social Media Platforms amoung youth",
    yaxisname: "% of youth on this platform",
    subcaption: "2012-2016",
    showhovereffect: "1",
    numbersuffix: "%",
    drawcrossline: "1",
    plottooltext: "<b>$dataValue</b> of youth were on $seriesName",
    theme: "fusion"
  },
  categories: [
    {
      category: [
        {
          label: "2012"
        },
        {
          label: "2013"
        },
        {
          label: "2014"
        },
        {
          label: "2015"
        },
        {
          label: "2016"
        }
      ]
    }
  ],

  dataset: [
    {
      seriesname: "Facebook",
      data: [
        {
          value: "62"
        },
        {
          value: "64"
        },
        {
          value: "64"
        },
        {
          value: "66"
        },
        {
          value: "78"
        }
      ]
    },

    {
      seriesname: "Instagram",
      data: [
        {
          value: "16"
        },
        {
          value: "28"
        },
        {
          value: "34"
        },
        {
          value: "42"
        },
        {
          value: "54"
        }
      ]
    },
    {
      seriesname: "LinkedIn",
      data: [
        {
          value: "20"
        },
        {
          value: "22"
        },
        {
          value: "27"
        },
        {
          value: "22"
        },
        {
          value: "29"
        }
      ]
    },

    {
      seriesname: "Twitter",
      data: [
        {
          value: "18"
        },
        {
          value: "19"
        },
        {
          value: "21"
        },
        {
          value: "21"
        },
        {
          value: "24"
        }
      ]
    }
  ]
};
3. Finally, you can render the graph with this code:
class MyComponent extends React.Component {
  render() {
    return (
      <ReactFusioncharts
        type="msline"
        width="100%"
        height="100%"
        dataFormat="JSON"
        dataSource={dataSource}
      />
    );
  }
}
Source Code:
You can find the source code right here.
That’s it! You have successfully developed a React graph using FusionCharts. As you can see, the process is very simple. There is no complexity. You just need to go through three simple steps. FusionCharts also allows you to get the job done with significantly less code. You can effortlessly build React graphs with FusionCharts.
Can FusionCharts Really Make My Life Easier?
FusionCharts is a powerful JavaScript charting library. It helps you to create interactive React graphs with just a few lines of code. It offers a huge collection of graphs and charts, giving you plenty of options to effectively visualize the data. Also, the documentation is comprehensive. By following it, you can effortlessly develop beautiful graphs for your web application. FusionCharts can definitely make your life a lot easier.