Create Line, Pie, Area, Bar, Column, Gantt and over 150 charts for your web application using the PHP Module for FusionCharts. Download the SDK framework to get started. Unlike other charting libraries that only allow creation of static images with low resolution, our charts are completely interactive and responsive on all screen sizes. Stop worrying about JavaScript methods and objects , simply write your application in native PHP or any major PHP frameworks like Laravel, CodeIgniter, or Symphony; fetch data from your SQL servers and directly create charts that are responsive, interactive, and support zooming, panning, APIs, animation, drill-downs, real-time updates, with full exporting of data charts & dashboards, all in your own server!
In addition to directly specifying the chart data (or the URL for the file in which the chart data is stored) directly in the JSON/XML code, you can also fetch data for the chart from a database. You can also navigate all of the chart attributes over in the documentation.
In this post we will show you how to build basic interactive charts, a 3d pie chart, a world map, and a gauge chart all for free without writing a single line of Javascript.
Table of Contents
How can I make a simple chart in PHP for free?
The trial version of FusionCharts does not have any feature or time restriction. It just includes a link to www.fusioncharts.com in your chart. If you would like to use charts for commercial usage, without this link, please purchase a license. If you’re an existing customer, you can download your licensed version here.
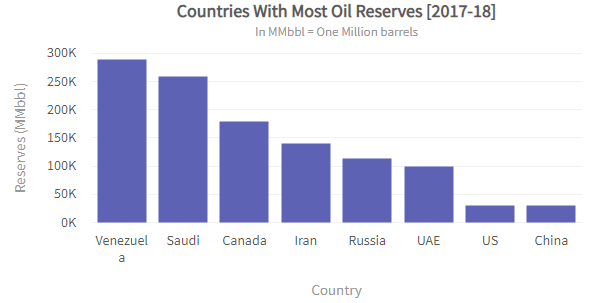
You’ll notice the FusionCharts SDK framework included at the top of the PHP below. Next you will see the initialization of the chart class with all of the parameters passed in plus the data as JSON. Finally, render() is called to output the chart. The render command takes all of the backend chart parameters and writes out everything it needs for the web browser client to render the chart.
<?php
include("includes/fusioncharts.php");

$columnChart = new FusionCharts("column2d", "ex1", "100%", 400, "chart-1", "json", '{
  "chart": {
    "caption": "Countries With Most Oil Reserves [2017-18]",
    "subcaption": "In MMbbl = One Million barrels",
    "xaxisname": "Country",
    "yaxisname": "Reserves (MMbbl)",
    "numbersuffix": "K",
    "theme": "fusion"
  },
  "data": [
    {
      "label": "Venezuela",
      "value": "290"
    },
    {
      "label": "Saudi",
      "value": "260"
    },
    {
      "label": "Canada",
      "value": "180"
    },
    {
      "label": "Iran",
      "value": "140"
    },
    {
      "label": "Russia",
      "value": "115"
    },
    {
      "label": "UAE",
      "value": "100"
    },
    {
      "label": "US",
      "value": "30"
    },
    {
      "label": "China",
      "value": "30"
    }
  ]
}');

$columnChart->render();
?>
How can I make a Pie Chart in 3D with PHP?
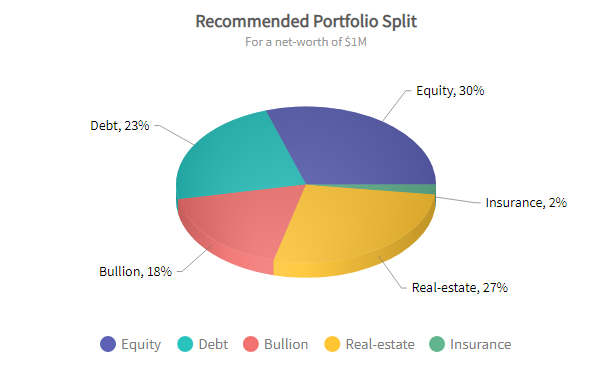
You’ll notice the FusionCharts SDK framework included at the top of the PHP below. Next you will see the HTML head section where the FusionChart CSS and Javascript files are included. You will also see the $chartData variable which is a string filled with JSON. Finally, you will see the initialization of the chart class with all of the parameters passed in plus the data as $chartData. Render() is called to output the chart. The render command takes all of the backend chart parameters and writes out everything it needs for the web browser client to render the chart. You will also see a div named “chart-container” which is where the chart will be rendered.
<?php

    /* Include the `../src/fusioncharts.php` file that contains functions to embed the charts.*/
    include("../includes/fusioncharts.php");
?>
  <html>

    <head>
        <link rel="stylesheet" type="text/css" href="../FusionCharts/themes/fusioncharts.theme.fusion.css"></link>
        <title>FusionCharts | Pie 3D Chart</title>
        <!-- FusionCharts Library -->
        <script type="text/javascript" src="//cdn.fusioncharts.com/fusioncharts/latest/fusioncharts.js"></script>
        <script type="text/javascript" src="//cdn.fusioncharts.com/fusioncharts/latest/themes/fusioncharts.theme.fusion.js"></script>
        <!--
            <script type="text/javascript" src="//cdn.fusioncharts.com/fusioncharts/latest/themes/fusioncharts.theme.gammel.js"></script>
            <script type="text/javascript" src="//cdn.fusioncharts.com/fusioncharts/latest/themes/fusioncharts.theme.zune.js"></script>
            <script type="text/javascript" src="//cdn.fusioncharts.com/fusioncharts/latest/themes/fusioncharts.theme.carbon.js"></script>
            <script type="text/javascript" src="//cdn.fusioncharts.com/fusioncharts/latest/themes/fusioncharts.theme.ocean.js"></script>
        -->
    </head>

    <body>

        <?php
                $chartData = "{
                    \"chart\": {
                      \"caption\": \"Recommended Portfolio Split\",
                      \"subCaption\" : \"For a net-worth of $1M\",
                      \"showValues\":\"1\",
                      \"showPercentInTooltip\" : \"0\",
                      \"numberPrefix\" : \"$\",
                      \"enableMultiSlicing\":\"1\",
                      \"theme\": \"fusion\"
                    },
                    \"data\": [{
                      \"label\": \"Equity\",
                      \"value\": \"300000\"
                    }, {
                      \"label\": \"Debt\",
                      \"value\": \"230000\"
                    }, {
                      \"label\": \"Bullion\",
                      \"value\": \"180000\"
                    }, {
                      \"label\": \"Real-estate\",
                      \"value\": \"270000\"
                    }, {
                      \"label\": \"Insurance\",
                      \"value\": \"20000\"
                    }]
                  }";

      // chart object
      $Chart = new FusionCharts("pie3d", "chart-1" , "600", "400", "chart-container", "json", $chartData);

      // Render the chart
      $Chart->render();

?>
        <h3>Pie 3D Chart</h3>
        <div id="chart-container">Chart will render here!</div>
        <br/>
        <br/>
        <a href="../index.php">Go Back</a>
    </body>

    </html>
How can I make a world map chart in PHP?
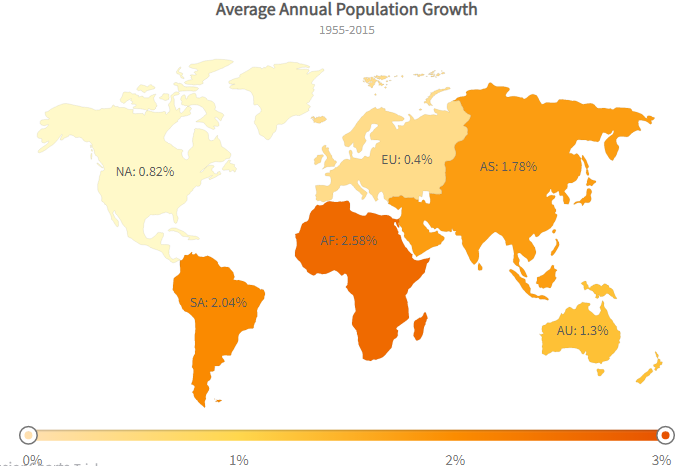
In this version of the FusionChart PHP code you will see how it takes multiple arrays that it builds in PHP, encodes them into JSON, and then passes it to the FusionCharts initialization class in PHP. Notice that the CSS and Javascript are loading off of FusionCharts CDN.
<?php

    /// Include the `../src/fusioncharts.php` file that contains functions to embed the charts.
    include("../includes/fusioncharts.php");
?>
  <html>

    <head>
        <link rel="stylesheet" type="text/css" href="../FusionCharts/themes/fusioncharts.theme.fusion.css"></link>
        <title>FusionCharts | Simple Map Using Array</title>
        <!-- FusionCharts Library -->
        <script type="text/javascript" src="//cdn.fusioncharts.com/fusioncharts/latest/fusioncharts.js"></script>
        <script type="text/javascript" src="//cdn.fusioncharts.com/fusioncharts/latest/themes/fusioncharts.theme.fusion.js"></script>
        <!--
            <script type="text/javascript" src="//cdn.fusioncharts.com/fusioncharts/latest/themes/fusioncharts.theme.gammel.js"></script>
            <script type="text/javascript" src="//cdn.fusioncharts.com/fusioncharts/latest/themes/fusioncharts.theme.zune.js"></script>
            <script type="text/javascript" src="//cdn.fusioncharts.com/fusioncharts/latest/themes/fusioncharts.theme.carbon.js"></script>
            <script type="text/javascript" src="//cdn.fusioncharts.com/fusioncharts/latest/themes/fusioncharts.theme.ocean.js"></script>
        -->
    </head>

    <body>

        <?php
            // Widget appearance configuration
            $arrMapConfig = array(
                "chart" => array(
                    "caption" => "Average Annual Population Growth",
                    "subcaption" => " 1955-2015",
                    "numbersuffix" => "%",
                    "includevalueinlabels" => "1",
                    "labelsepchar" => ": ",
                    "entityFillHoverColor" => "#FFF9C4",
                    "theme" => "fusion"
                )
            );

            // Widget color range data
            $colorDataObj = array("minvalue" => "0", "code" => "#FFE0B2", "gradient" => "1",
                                    "color" => array(
                                        ["minValue" => "0", "maxValue" => "50", "code" => "#F2726F"],
                                        ["minValue" => "50", "maxValue" => "75", "code" => "#FFC533"],
                                        ["minValue" => "75", "maxValue" => "100", "code" => "#62B58F"]
                                    )
                            );

            // Map data array
            $mapDataArray = array(
                ["NA", ".82", "1"],
                ["SA", "2.04", "1"],
                ["AS", "1.78", "1"],
                ["EU", ".40", "1"],
                ["AF", "2.58", "1"],
                ["AU", "1.30", "1"]
            );

            $mapData = array();

            for($i = 0; $i < count($mapDataArray); $i++) {
                array_push($mapData,array("id" => $mapDataArray[$i][0], "value" => $mapDataArray[$i][1], "showLabel" => $mapDataArray[$i][2]));
            }

            $arrMapConfig["colorRange"] = $colorDataObj;
            $arrMapConfig["data"] = $mapData;

            // JSON Encode the data to retrieve the string containing the JSON representation of the data in the array.
            $jsonEncodedData = json_encode($arrMapConfig);

            // Map object
            $Map = new FusionCharts("maps/world", "MyFirstMap" , "800", "500", "map-container", "json", $jsonEncodedData);

            // Render the Map
            $Map->render();

?>

        <h3>Simple Map Using Array</h3>
        <div id="map-container">Map will render here!</div>
        <br/>
        <br/>
        <a href="../index.php">Go Back</a>
    </body>

    </html>
How can I make a gauge chart in PHP?
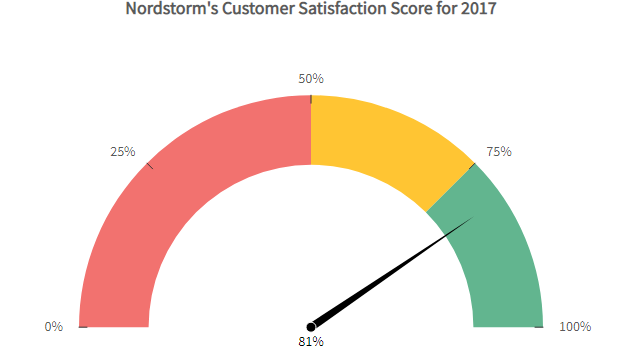
A gauge chart makes a great addition to any dashboard and it is really easy to create one for PHP with FusionCharts. You can see in the PHP code below there is the FusionCharts SDK framework included at the top, all of the necessary CSS and Javascript included in the page head section, the $gaugeData which is a PHP string containing JSON, and finally the new FusionCharts() and render() calls.
<?php

    /* Include the `../src/fusioncharts.php` file that contains functions to embed the charts.*/
    include("../includes/fusioncharts.php");
?>
  <html>

    <head>
        <title>FusionCharts | Angular Gauge</title>
        <!-- FusionCharts Library -->
        <script type="text/javascript" src="//cdn.fusioncharts.com/fusioncharts/latest/fusioncharts.js"></script>
        <script type="text/javascript" src="//cdn.fusioncharts.com/fusioncharts/latest/themes/fusioncharts.theme.fusion.js"></script>
    <!--
        <script type="text/javascript" src="//cdn.fusioncharts.com/fusioncharts/latest/themes/fusioncharts.theme.gammel.js"></script>
        <script type="text/javascript" src="//cdn.fusioncharts.com/fusioncharts/latest/themes/fusioncharts.theme.zune.js"></script>
        <script type="text/javascript" src="//cdn.fusioncharts.com/fusioncharts/latest/themes/fusioncharts.theme.carbon.js"></script>
        <script type="text/javascript" src="//cdn.fusioncharts.com/fusioncharts/latest/themes/fusioncharts.theme.ocean.js"></script>
    -->
    </head>

    <body>

        <?php
                $gaugeData = "{
                    \"chart\": {
                        \"caption\": \"Nordstorm's Customer Satisfaction Score for 2017\",
                        \"lowerLimit\": \"0\",
                        \"upperLimit\": \"100\",
                        \"showValue\": \"1\",
                        \"numberSuffix\": \"%\",
                        \"theme\": \"fusion\",
                        \"showToolTip\": \"0\"
                    },
                    \"colorRange\": {
                        \"color\": [{
                            \"minValue\": \"0\",
                            \"maxValue\": \"50\",
                            \"code\": \"#F2726F\"
                        }, {
                            \"minValue\": \"50\",
                            \"maxValue\": \"75\",
                            \"code\": \"#FFC533\"
                        }, {
                            \"minValue\": \"75\",
                            \"maxValue\": \"100\",
                            \"code\": \"#62B58F\"
                        }]
                    },
                    \"dials\": {
                        \"dial\": [{
                            \"value\": \"81\"
                        }]
                    }
                }";

      // chart object
      $Chart = new FusionCharts("angulargauge", "angulargauge-1" , "600", "400", "angulargauge-container", "json", $gaugeData);

      // Render the chart
      $Chart->render();

?>
        <h3>Angular Gauge</h3>
        <div id="angulargauge-container">Chart will render here!</div>
        <br/>
        <br/>
        <a href="../index.php">Go Back</a>
    </body>

    </html>
Ready to get started creating your first chart in PHP with FusionCharts? Check out the documentation!