
EmberJS is a JavaScript based front-end framework that helps developers:
- build websites with rich and complex user interactions
- manage the complexity in modern web applications.
The open-source framework also comes with an integrated development toolkit that enables rapid developmental iterations. Ember projects are created and managed through the command line build tool Ember CLI.
Table of Contents
Key features of Ember.JS
- EmberJS implements the Model View Controller (MVC) architecture for an application; the structure is auto-generated every time a new EmberJS application is created using the CLI.
- EmberJS incorporates the commonly followed programming idioms and best practices, thus enabling developers to come up with scalable single-page web applications.
- Although it was primarily designed to be a framework for the web, EmberJS can also be used for creating mobile and desktop applications.
- EmberJS has a pluggable architecture that aids in enhancing and extending the capabilities of the framework.
- The EmberJS framework maintains backward compatibility even as it continues to evolve.
Basic concepts related to Ember.JS
Routes – In Ember, a URL is used to represent the application’s state. A route object, corresponding to each URL, is used to control what is visible to the user. Routes are useful for redirecting towards the several route templates within the same application by hitting the URL appending the route names.
Models – A model contains data about an application’s state. Each model is associated with a route.
Templates – To ease the setup and configuration of the MVC architecture, EmberJS comes with templates written in Handlebars that help define what the user interface looks like.
Components – The component controls the behaviour of the user interface and consists of two parts:
HBS – a template that defines the UI of the page
Controller – a source file written in JavaScript that defines the behavior of the UI
In this article, we are using components to modify a chart that is rendered in the UI template file. These components can also be reused for UI visualization in other templates.
About FusionCharts
FusionCharts Suite XT is a JavaScript based charting solution that runs on desktop and mobile platforms. The various charts and maps that are a part of the charting library enable effective data analysis through data visualization. The library also includes several basic and advanced configuration options that help to add value to the data being showcased.
Prerequisites
Before we proceed with seeing how you can integrate FusionCharts with an EmberJS application, you need to:
- Have a basic understanding of HTML, CSS, JavaScript, and Document Object Model (DOM)
- Download and install NodeJS (NPM) to make use of the Command Line Interface (CLI)
- Install Ember CLI via NPM (Installation details in the steps below)
- Download FusionCharts
Steps to render a chart using an EmberJS component within an EmberJS web app
Step 1
Install NodeJS (if not installed already)
Step 2
Install Ember CLI.
To do this:
Go the directory in which you want to setup your project.
Execute the following command from the command prompt:
npm install -g ember-cli
After EmberJS is installed successfully, use the following command to check the version details:
ember -v
Step 3
Create a new Ember Project, named TestEmber, using the following command:
ember new TestEmber
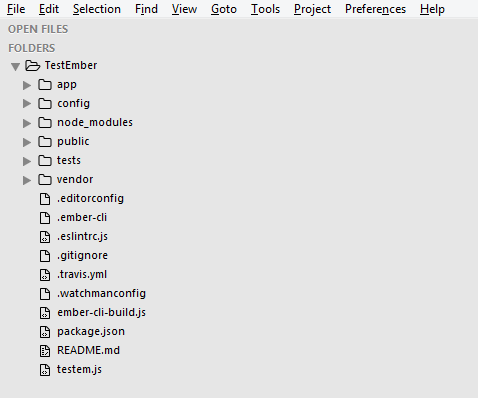
When the project is created, the file structure for the Ember project is automatically generated in the working directory.
The file structure of the Ember project, TestEmber, looks as shown in the image below:
Step 4
Run the project.
To start running the project:
Start the server using the following command:
ember serve
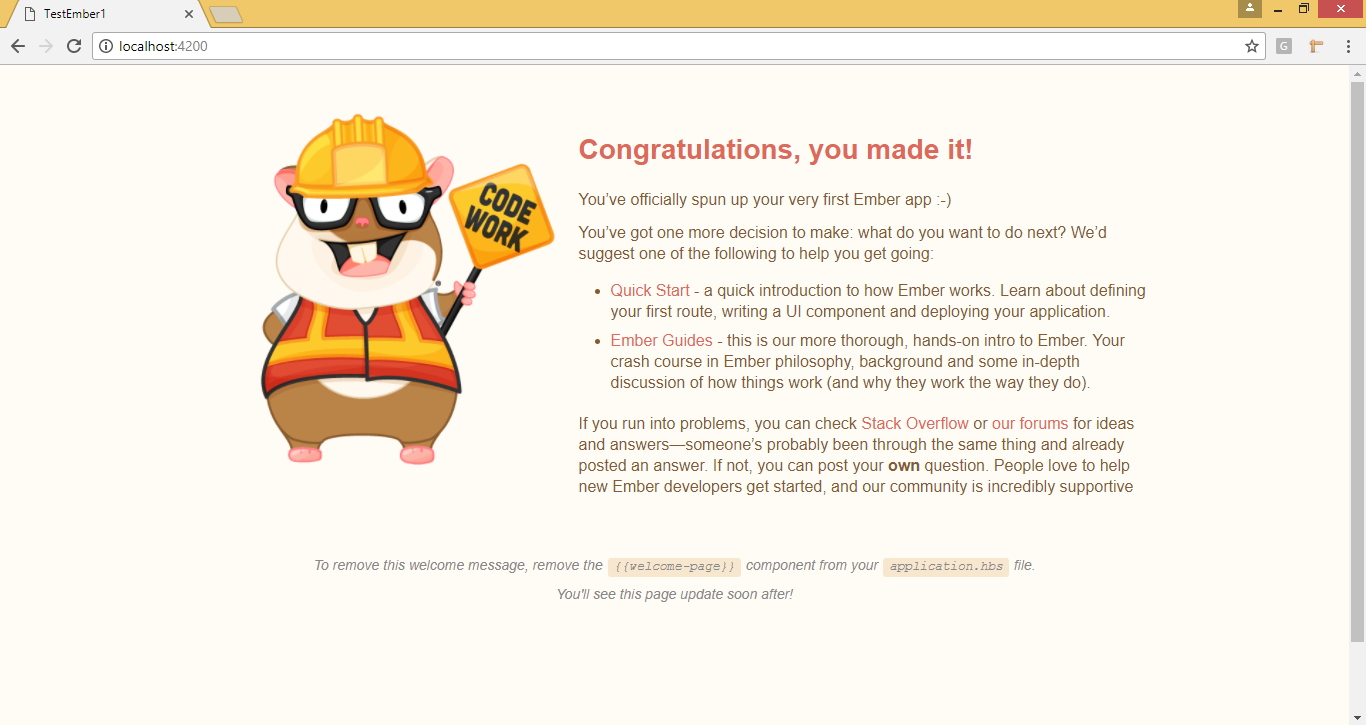
Type the url localhost: 4200 in your browser (because 4200 is the default port being used).
Your project is running successfully if you can see the Ember landing page, as shown in the image below:
Step 5
Install FusionCharts via NPM in the TestEmber project directory, using the following command:
npm install fusioncharts
The node_modules folder will now have the entire FusionCharts library within it.
Step 6
Include the required JavaScript files from node_modules into the TestEmber project.
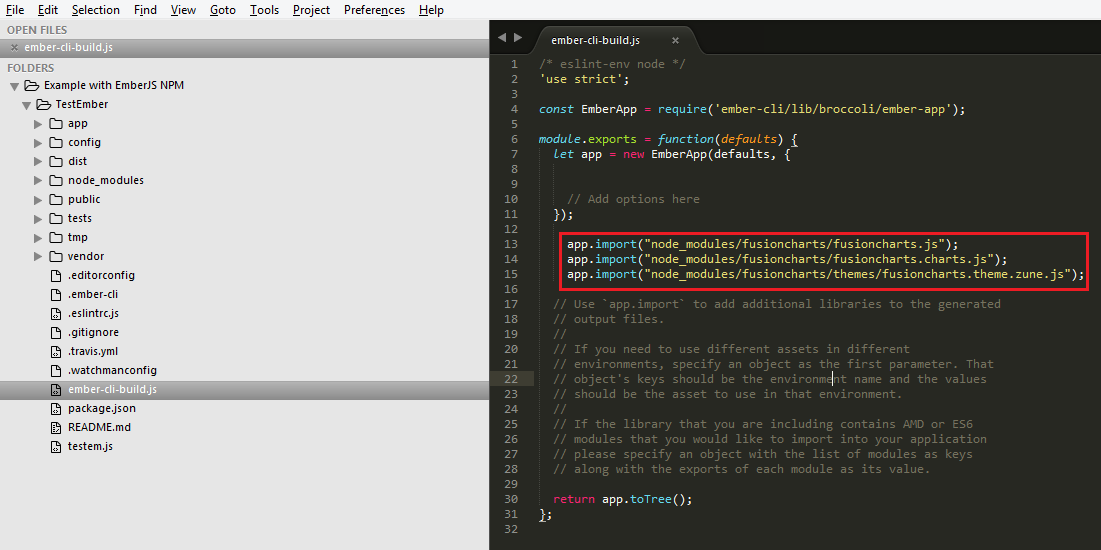
To do this, include the following import statements in the ember-cli-build.js file:
app.import(“node_modules/fusioncharts/fusioncharts.js”);
app.import(“node_modules/fusioncharts/fusioncharts.charts.js”);
app.import("node_modules/fusioncharts/themes/fusioncharts.theme.zune.js");
A screenshot of the ember-cli-build.js file, after including the above set of commands, is shown in the image below:
Step 7
Create routes in the TestEmber project.
To generate a “route” in the TestEmber project use the following command :
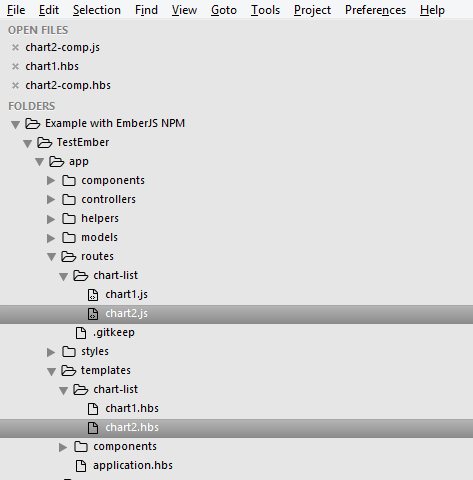
ember g route ChartList/chart2
This will create a route file, chart2.js, under the routes folder structure. In addition, a template file, chart2.hbs, is also created under the templates folder structure.
The .js file is the route handler file, which defines what should happen when the route template is loaded.
The .hbs file is a Handlebars template file that contains static HTML to generate the application UI and dynamic content (scripts) for rendering charts using FusionCharts. Click here to read more about handlebars.
The directory structure of the TestEmber project now looks as shown in the image below:
Step 8
Create the component for the TestEmber project using the following command:
ember g component chart2-comp
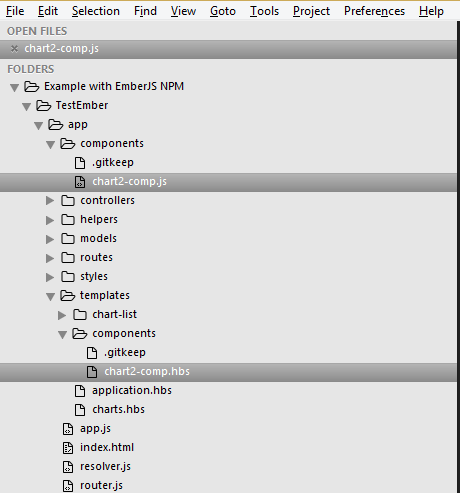
Upon execution of the above command, the directory structure of the TestEmber project will be modified to include the components.
The modified directory structure looks as shown in the image below:
Step 9
Define the UI and its behavior.
The image below shows the intended UI visualization for this sample:
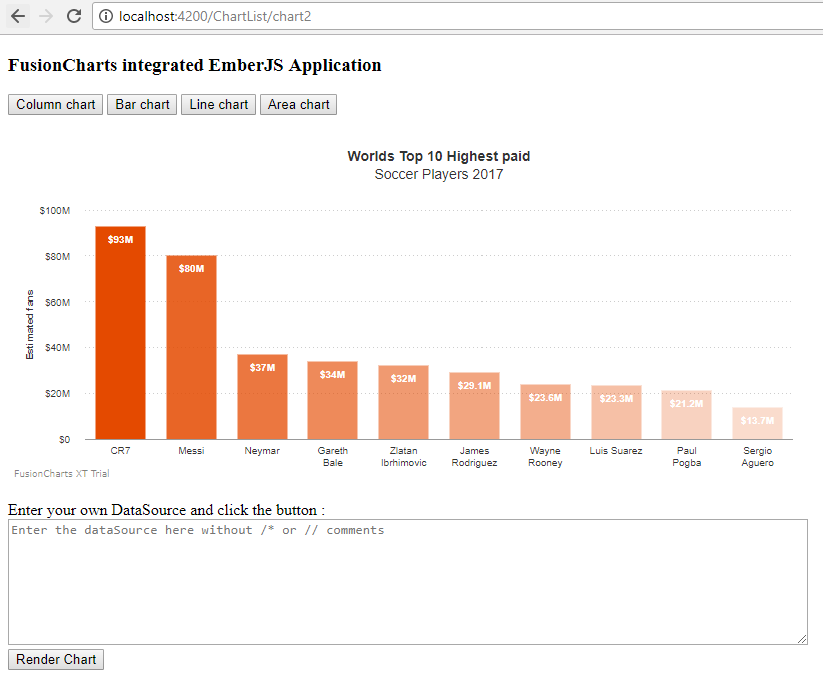
Based on this visualization, you need to:
- Create charts and a button corresponding to each chart. Click the button to render the chart.
- Provide a text area where the user can enter the data source for a custom chart. Add a button to render the chart when clicked.
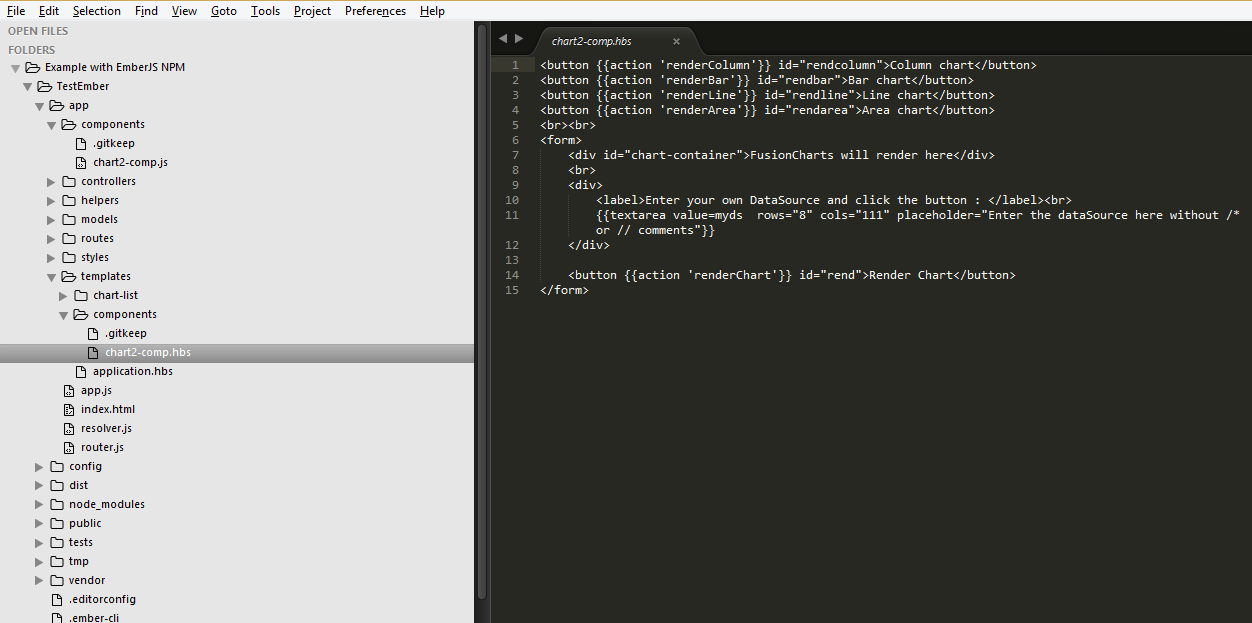
To define this UI, copy the following code and paste it into the chart2-comp.hbs file:
<button {{action 'renderColumn'}} id="rendcolumn">Column chart</button>
<button {{action 'renderBar'}} id="rendbar">Bar chart</button>
<button {{action 'renderLine'}} id="rendline">Line chart</button>
<button {{action 'renderArea'}} id="rendarea">Area chart</button>
<br><br>
<form>
    <div id="chart-container">FusionCharts will render here</div>
    <br>
    <div>
        <label>Enter your own DataSource and click the button : </label><br>
        {{textarea value=myds  rows="8" cols="99" placeholder="Enter the dataSource here without /* or // comments"}}
    </div>

    <button {{action 'renderChart'}} id="rend">Render Chart</button>
</form>
A screenshot of the chart2-comp.hbs file, after including the above code, is shown in the image below:
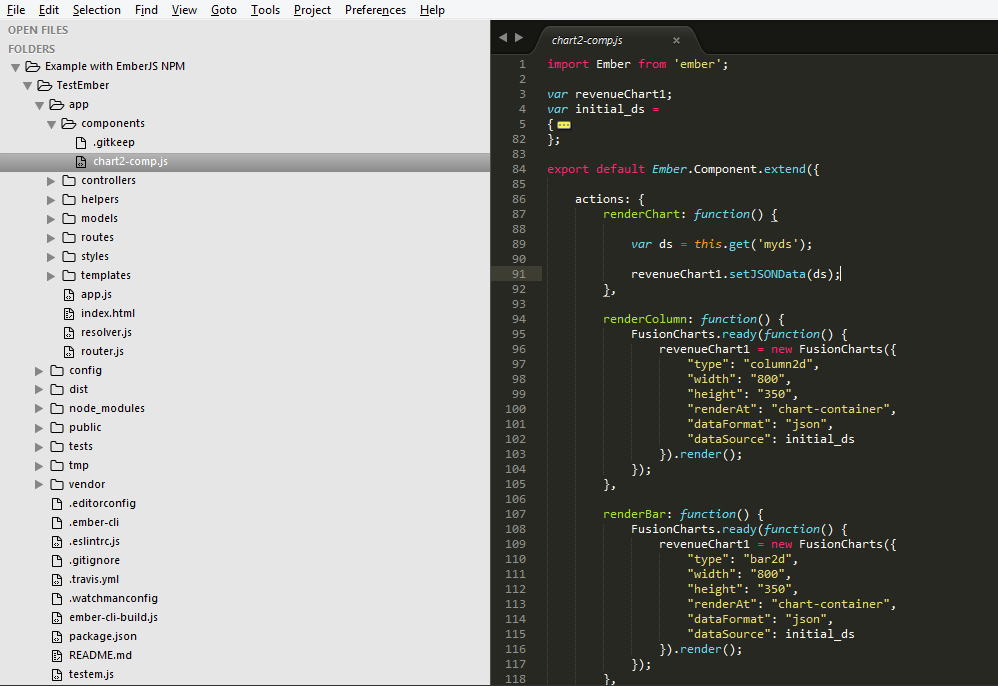
When you click the button for a chart type, the corresponding chart will be rendered based on the actions defined in the chart2-comp.js file in the App/Components folder.
Similarly, when the data source is entered in the text area field and the corresponding button is clicked, the data source is fetched and passed to the chart2-comp.js file, via the action specified for the button.
To define this behavior of the UI, copy the following code and paste it in the chart2-comp.js file:
import Ember from 'ember';

var revenueChart1;
var initial_ds =
{
    "chart": {
        "caption": "Worlds Top 10 Highest paid",
        "subCaption": "Soccer Players 2017",
        "yAxisName": "Earnings (In USD)",
        "numberPrefix": "$",

        //Cosmetics
                  "captionpadding": "30",
                     "yaxisname": "Estimated fans",
                     "rotatevalues": "0",
                     "divlinecolor": "#CCCCCC",
                     "yaxisvaluespadding": "15",
                     "valuefontbold": "1",
                     "labelsepchar": ": ",
                     "labeldisplay": "AUTO",
                     "numberscalevalue": "1000,1000,1000",
                     "numberscaleunit": "K,M,B",
                     "animation": "0",
                     "palettecolors": "e44a00",
                     "theme": "zune",
                     "valueBgAlpha": "0",

                     "usePlotGradientColor": "0"
    },
    "data": [
        {
            "label": "CR7",
            "value": "93000000",
            "alpha": "100"
        },
        {
            "label": "Messi",
            "value": "80000000",
            "alpha": "85"
        },
        {
            "label": "Neymar",
            "value": "37000000",
            "alpha": "75"
        },
        {
            "label": "Gareth{br}Bale",
            "value": "34000000",
            "alpha": "65"
        },
        {
            "label": "Zlatan{br}Ibrhimovic",
            "value": "32000000",
            "alpha": "56"
        },
        {
            "label": "Wayne{br}Rooney",
            "value": "23600000",
            "alpha": "50"
        },
        {
            "label": "Luis Suarez",
            "value": "23300000",
            "alpha": "45"
        },
        {
            "label": "Sergio{br}Aguero",
            "value": "13700000",
            "alpha": "35"
        },
        {
            "label": "James{br}Rodriguez",
            "value": "29100000",
            "alpha": "30"
        },
        {
            "label": "Paul{br}Pogba",
            "value": "21200000",
            "alpha": "20"
        }
    ]
};


export default Ember.Component.extend({

    actions: {
        renderChart: function() {

            var ds = this.get('myds');

            revenueChart1.setJSONData(ds);
        },

        renderColumn: function() {
            FusionCharts.ready(function() {
                revenueChart1 = new FusionCharts({
                    "type": "column2d",
                    "width": "800",
                    "height": "350",
                    "renderAt": "chart-container",
                    "dataFormat": "json",
                    "dataSource": initial_ds
                }).render();
            });
        },

        renderBar: function() {
            FusionCharts.ready(function() {
                revenueChart1 = new FusionCharts({
                    "type": "bar2d",
                    "width": "800",
                    "height": "350",
                    "renderAt": "chart-container",
                    "dataFormat": "json",
                    "dataSource": initial_ds
                }).render();
            });
        },

        renderLine: function() {
            FusionCharts.ready(function() {
                revenueChart1 = new FusionCharts({
                    "type": "line",
                    "width": "800",
                    "height": "350",
                    "renderAt": "chart-container",
                    "dataFormat": "json",
                    "dataSource": initial_ds
                }).render();
            });
        },

        renderArea: function() {
            FusionCharts.ready(function() {
                revenueChart1 = new FusionCharts({
                    "type": "area2d",
                    "width": "800",
                    "height": "350",
                    "renderAt": "chart-container",
                    "dataFormat": "json",
                    "dataSource": initial_ds
                }).render();
            });
        }
    }
});
A screenshot of the chart2-comp.js file, after including the above code, is shown in the image below:
Note:
The actions for buttons must be defined in the component file (chart2-comp.js). This can be seen in the image above.
The component name must have a hyphen (-) in it. This is the nomenclature followed by Ember in order to identify a component.
Step 10
Components, once created, can be reused in several different templates. We will include the component created above in the routes template that was created in Step 7.
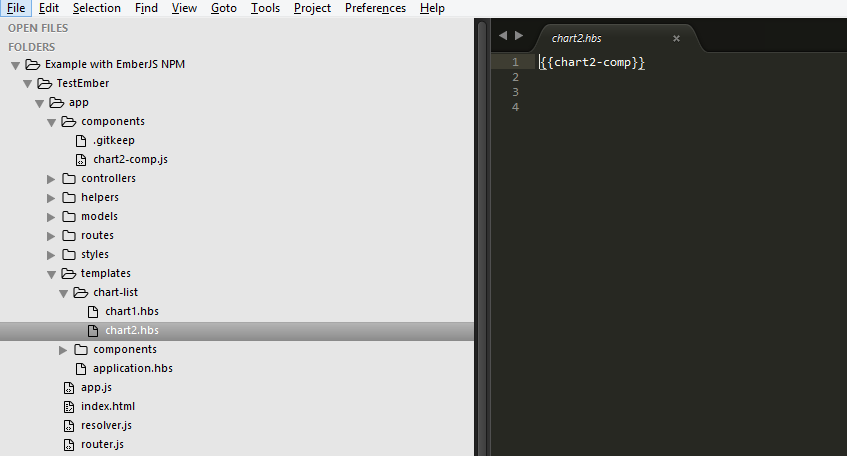
To do this, add the following code to the chart2.hbs file:
{{chart2-comp}}
A screenshot of the chart2.hbs file, after including the above code, is shown in the image below:
Step 11
Save all the files and run the project.
To run the project:
Start the server using the following command:
ember serve
Type the url localhost: 4200 in your browser (because 4200 is the default port being used).
Then hit the URL – localhost:4200/ChartList/chart2
Output
Your output should look as seen in the image below:

If you followed the steps closely, you’ll get output as shown above. If you still face problems, you can view the source code.
Troubleshooting:
If you are unable to see the chart, check that:
*the chart ID is unique for all charts rendered on the same page or it will result in a JavaScript error.
*the fusioncharts.js and other related library files are properly included (especially if the chart does not show up at all)
*the path to the included files is correct and the files reside there
*the chart alias names are correctly spelt.