
With the number of smartphone users globally pegged at 2.3 billion, there is a distinctive shift in the consumption of digital media. While users have been consuming online content from desktops, of late trends show a rise in consumption through smartphones. This has resulted in a massive number of apps. However, the hurdle with this is that we need to develop apps for individual platforms. To overcome this, hybrid apps are gaining popularity.
Table of Contents
Creating mobile apps using Ionic 2 Framework
A hybrid app uses web technologies like HTML, CSS, and JavaScript along with the native wrapper so that it can be installed on a mobile device. This method does away with the overheads of developing the app using native programming languages like Java, Objective C. Additionally; it allows to quickly deploy apps across multiple platforms like Android, iOS, Windows Phone without having to develop individual apps. A more significant advantage of deploying hybrid apps is that you can update your app without having to republish it through the app stores, thereby saving a lot of time and unnecessary effort.
While there are a couple of hybrid frameworks, the Ionic framework is gaining widespread popularity, primarily because of its dependence on Angular. The framework uses the Cordova native wrapper, which enables the HTML/CSS/JavaScript to be loaded in a web-view when the mobile app is fired up. Moreover, Cordova has plugins that allow you to communicate with the native features of your mobile device using just JavaScript.
Today we shall create a chart in a mobile app using a hybrid framework—Ionic 2. We will use the FusionCharts JavaScript charting library to create charts in the apps. The reason for preferring Ionic 2 is that it is based on Angular. Interestingly, the FusionCharts library has an Angular extension, which will make the process of creating the charts quick and simple.
Requirements
To create a chart in a mobile app developed using Ionic 2, you will need the following components downloaded and installed:
-
- Ionic framework –
-
- FusionCharts Library –
-
- Angular-FusionCharts Directive –
Creating charts in Ionic 2
Step 1: Creating an app in Ionic 2
To get started, we need to create an app in the Ionic 2 framework.
- Run the following command from the shell interface.
ionic start myapp
This will automatically create all the dependencies required to create the app.
Step 2: Installing Dependencies
Next, we need to integrate the FusionCharts library in the Ionic 2 framework.
- Install the FusionCharts-Angular extension in the
project node_modulesusing the following command.
npm install angular2 -fusioncharts --save - Import the files into the
app.module.tsfile. [Path: src → app → app.module.ts]
import { BrowserModule } from '@angular/platform-browser';
import { ErrorHandler, NgModule } from '@angular/core';
import { IonicApp, IonicErrorHandler, IonicModule } from 'ionic-angular';
import { SplashScreen } from '@ionic-native/splash-screen';
import { StatusBar } from '@ionic-native/status-bar';

import { MyApp } from './app.component';
import { HomePage } from '../pages/home/home';

// Import angular2-fusioncharts
import { FusionChartsModule } from 'angular2-fusioncharts';

// Import FusionCharts library
import * as FusionCharts from 'fusioncharts';
// Load FusionCharts Charts module
import Charts from "fusioncharts/fusioncharts.charts";
// Load themes
import themes from "fusioncharts/themes/fusioncharts.theme.fint";


@NgModule({
  declarations: [
    MyApp,
    HomePage
  ],
  imports: [
    BrowserModule,
      FusionChartsModule.forRoot(FusionCharts, Charts, themes),
    IonicModule.forRoot(MyApp)
  ],
  bootstrap: [IonicApp],
  entryComponents: [
    MyApp,
    HomePage
  ],
  providers: [
   StatusBar,
  SplashScreen,
    {provide: ErrorHandler, useClass: IonicErrorHandler}
  ]
})
export class AppModule {}
Step 3: Configuring the chart
Now we need to provide the data that would be used to render the chart. The data source has to be updated in the home.ts file located in [Path: src → home → home.ts]
- Update the data source for rendering the chart in the
home.tsfile.
import { Component } from '@angular/core';
import { NavController } from 'ionic-angular';
@Component({
selector: 'page-home',
templateUrl: 'home.html'
})
export class HomePage {
dataSource: Object;
constructor(public navCtrl: NavController) {
this.dataSource = {
"chart": {
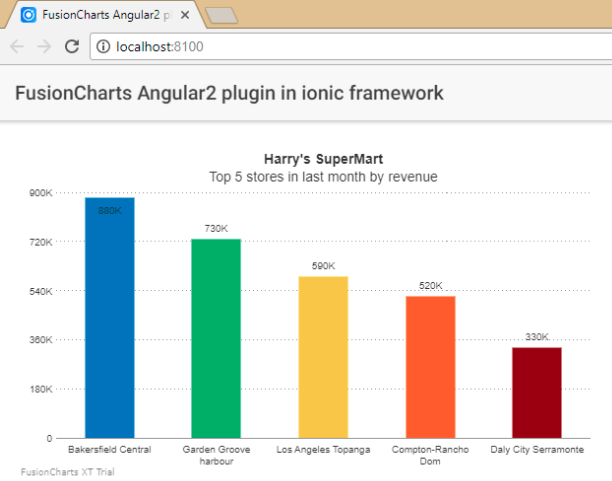
"caption": "Harry's SuperMart",
"subCaption": "Top 5 stores in last month by revenue",
"theme":"fint"
},
"data": [{
"label": "Bakersfield Central",
"value": "880000"
}, {
"label": "Garden Groove harbour",
"value": "730000"
}, {
"label": "Los Angeles Topanga",
"value": "590000"
}, {
"label": "Compton-Rancho Dom",
"value": "520000"
}, {
"label": "Daly City Serramonte",
"value": "330000"
}]
}
}
}
Step 4: Creating the FusionCharts directive
Now that the data is added, we need to create the FusionCharts directive that will create the chart element.
- Add the following code to the
home.htmlfile. [Path: src → home → home.html]
<ion-header>
  <ion-navbar>
    <ion-title>
      FusionCharts Angular2 plugin in ionic framework
    </ion-title>
  </ion-navbar>
</ion-header>

<ion-content padding>
<fusioncharts
          width="600"
          height="350"
          type="Column2D"
          dataFormat="JSON"
          [dataSource]="dataSource">

      </fusioncharts>
</ion-content>
Step 5: Rendering the chart
Now that we have our code in place, let us run the code to see the output.
- Run the following command from the shell interface.
ionic serve
If you’ve followed the steps closely, your output should like the chart shown in the image below:
If you see any errors in your code, you can download the complete source code of the sample project we have created for this tutorial.


Sanjay M
May 1, 2018, 11:14 amthanks a ton this was really useful!
Jonathan
May 7, 2018, 1:07 pmGlad it helped!
piccosoft
June 4, 2018, 4:00 pmYour blog is very nice… Thanks for sharing your information…