Backend-as-a-Service—BaaS—is a mobile-based backend service that lets web and mobile application developers link their applications to the backend cloud storage. Firebase, a provider of BaaS, allows developers to create delightful user experiences by simplifying management—the developers don’t need to focus on managing the servers. Firebase becomes the server, the datastore, as well the API, all of which is designed generically and customized to requirement. Other advantages of Firebase include:
- JSON storage, which eliminates the barrier between objects and data
- Multi-database support
- Minimal requirements for setup
- Simplified app state serialization
- Accessible data, files, authorizations, and more
- Potential to increase storage size significantly
In this tutorial, we’ll discuss the process for creating dynamic charts by fetching data from Firebase Realtime Database. For this, we will be using FusionCharts, a JavaScript-based charting library.
Table of Contents
Including Dependencies
Before we start, we need to set up the following dependencies:
FusionCharts Core JS Files [Download Link]
Firebase Realtime Database
Including the FusionCharts Core Package JS Files
Given below is the code to include the core JS files, fusioncharts.js and fusioncharts.charts.js, downloaded as part of the FusionCharts package, in the HTML file:
<html>
    <head>
        <!-- including FusionCharts core package JS files -->
        <script src="path/to/fusioncharts.js"></script>
        <script src="path/to/fusioncharts.charts.js"></script>
    </head>
</html>
Including and Initializing Firebase Realtime Database
Step 1
To use Firebase and its real-time database, we need to first include the firebase-app.js and firebase-database.js files in our HTML file.
Given below is the code to do this, that will go in our HTML file:
<!-- including Firebase -->
<script src="https://www.gstatic.com/firebasejs/4.6.2/firebase-app.js"></script>
<script src="https://www.gstatic.com/firebasejs/4.6.2/firebase-database.js"></script>
Step 2
Now that we have included all the dependencies needed for our tutorial, we will create a local JavaScript file, app.js, that we will use to initialize Firebase.
Given below is the code to initialize and connect to our Firebase app:
// Initialize Firebase
var config = {
    apiKey: "AIzaSyCUGTrY5OD1uBupNIHvCRxEO1NKYVlPtDM",
    authDomain: "fusioncharts-demo.firebaseapp.com",
    databaseURL: "https://fusioncharts-demo.firebaseio.com",
    projectId: "fusioncharts-demo",
    storageBucket: "fusioncharts-demo.appspot.com",
    messagingSenderId: "728123238984"
};

firebase.initializeApp(config);
Here, the config object includes details like the API key, the app domain URI, the app database URI, and the project ID that will be needed to establish a connection with our Firebase Realtime Database.
NOTE: You can get these config details from the project overview page in the Firebase console.
Step 3
Next, we will include the app.js JavaScript file in our HTML file, after we have included the dependencies for Firebase.
Given below is the code to do this, that will go in our HTML file:
<script src="path/to/app.js"></script>Step 4
Now, we’ll need a database that will store the chart data for this tutorial.
We have already created a dummy database that we will be using for this tutorial. Here’s the JSON structure for the same:
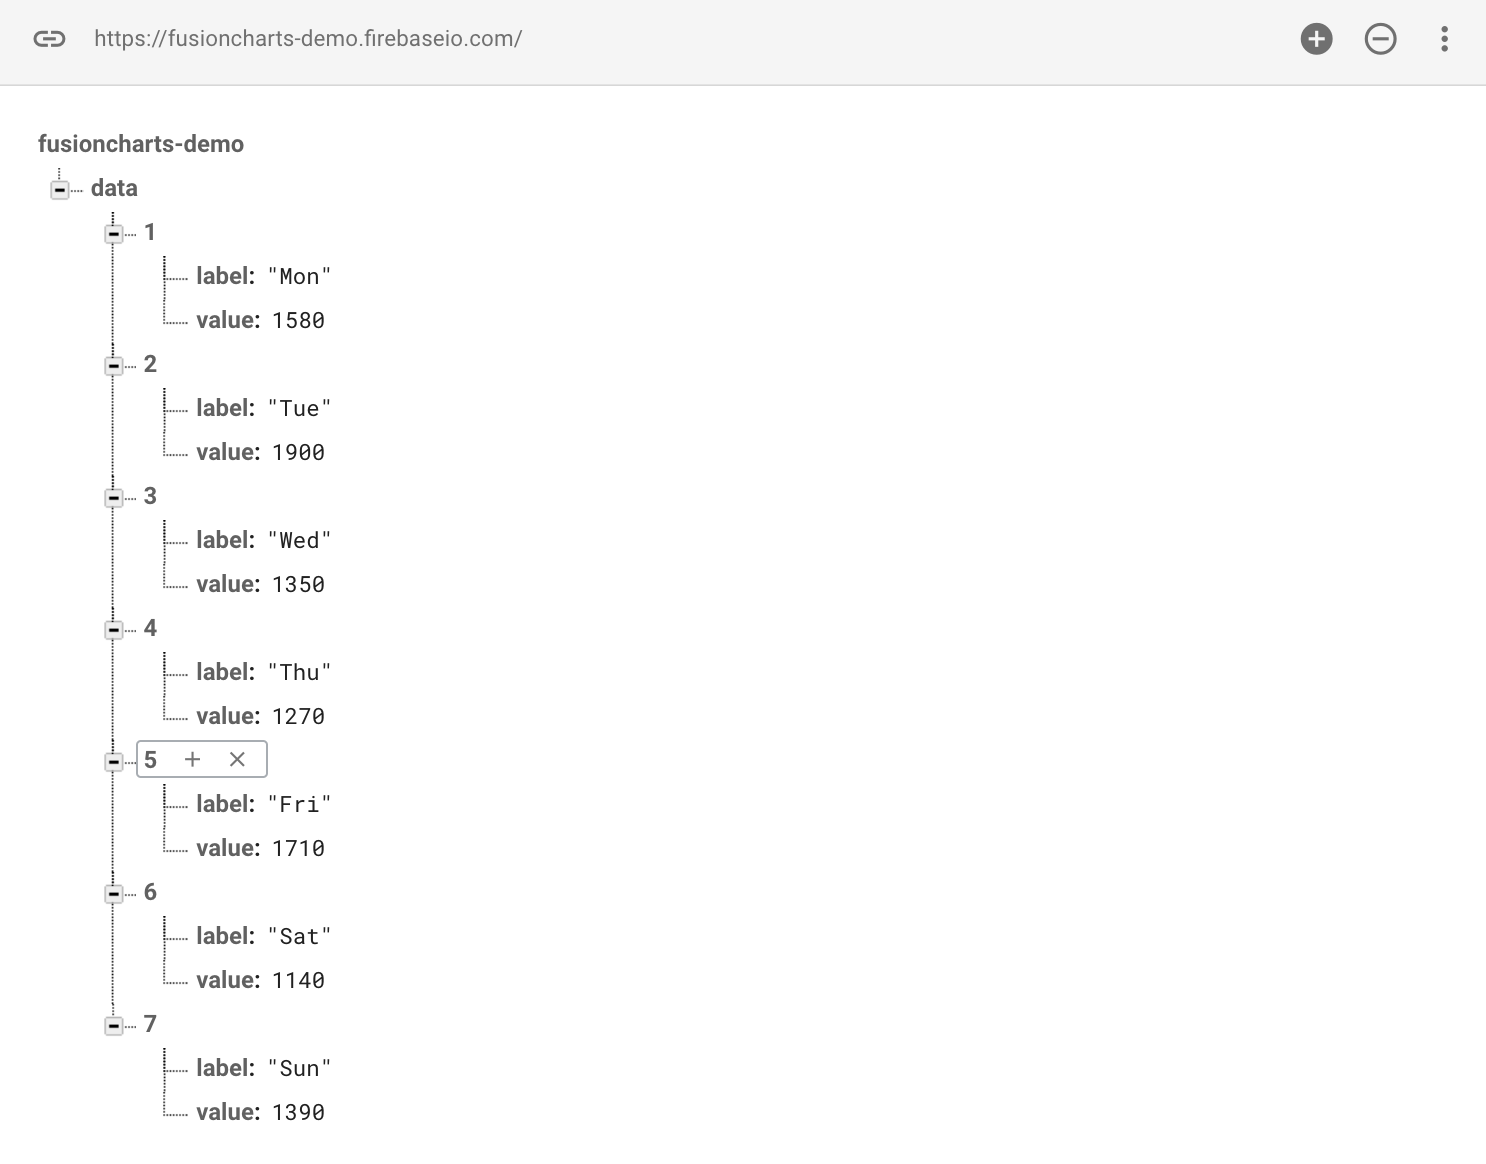
To access the data from our Firebase Realtime Database, we need to make sure that our HTML page/website is allowed to read data. To do this, we will modify the default database rules from our Firebase project’s console.
Given below are the rules that we will be using for this tutorial:
{
    "rules": {
        ".read": true,
        ".write": "auth != null"
    }
}
You can refer to this link to know more about security and rules for Firebase Realtime Database.
Fetching and Forming JSON Data
Step 1
Once we have initialized Firebase, we will reference the data from our database by creating a function that will take a snapshot of the data.
Create a function, getData, and add the following code to the function:
function getData(callbackIN) {
    var ref = firebase.database().ref("data");
        ref.once('value').then(function (snapshot) {
        callbackIN(snapshot.val())
    });
}
Step 2
Take a snapshot of the data in the database and form a JSON array that we’ll use as the datasource for our chart.
Given below is the code to do this:
window.addEventListener("load", getData(genFunction));

function genFunction(data) {
    var cdata = [];
    var len = data.length;
    for(var i=1; i<len; i++) {
        cdata.push({
        label: data[i]['label'],
        value: data[i]['value']
    });
}
After the above code is executes successfully, the cdata variable will hold the JSON array, which contains the chart data.
Creating the Chart Container
Every chart displayed on a web page gets rendered within a unique HTML container. We will use the <div> element for creating the HTML container for our chart.
Given below is the code for creating the chart container:
<body>
    <!-- chart container -->
    <div id="chart-container"></div>
</body>
Creating the Chart Instance and Rendering the Chart
Now that we have the JSON data and the chart container in place, we will create the FusionCharts instance. Details needed to render the chart, like the chart type, the chart ID, chart dimensions, the HTML container ID, and so on, will be passed to this chart instance.
Given below is the code we will be using to create the chart instance:
var firebaseChart = new FusionCharts({
    type: 'area2d',
    renderAt: 'chart-container',
    width: '650',
    height: '400',
    dataFormat: 'json',
    dataSource: {
    "chart": {
        "caption": "Website Visitors Trend",
        "subCaption": "Last 7 Days{br}ACME Inc.",
        "subCaptionFontBold": "0",
        "captionFontSize": "20",
        "subCaptionFontSize": "17",
        "captionPadding": "15",
        "captionFontColor": "#8C8C8C",
        "baseFontSize": "14",
        "baseFont": "Barlow",
        "canvasBgAlpha": "0",
        "bgColor": "#FFFFFF",
        "bgAlpha": "100",
        "showBorder": "0",
        "showCanvasBorder": "0",
        "showPlotBorder": "0",
        "showAlternateHGridColor": "0",
        "usePlotGradientColor": "0",
        "paletteColors": "#6AC1A5",
        "showValues": "0",
        "divLineAlpha": "5",
        "showAxisLines": "1",
        "drawAnchors": "0",
        "xAxisLineColor": "#8C8C8C",
        "xAxisLineThickness": "0.7",
        "xAxisLineAlpha": "50",
        "yAxisLineColor": "#8C8C8C",
        "yAxisLineThickness": "0.7",
        "yAxisLineAlpha": "50",
        "baseFontColor": "#8C8C8C",
        "toolTipBgColor": "#FA8D67",
        "toolTipPadding": "10",
        "toolTipColor": "#FFFFFF",
        "toolTipBorderRadius": "3",
        "toolTipBorderAlpha": "0",
        "drawCrossLine": "1",
        "crossLineColor": "#8C8C8C",
        "crossLineAlpha": "60",
        "crossLineThickness": "0.7",
        "alignCaptionWithCanvas": "1"
    },

    "data": cdata
    }
});
Now, we will call the render() method for our chart instance to render the chart, as given below:
firebaseChart.render();If you have followed the above steps correctly, your output should look as shown in the image below:
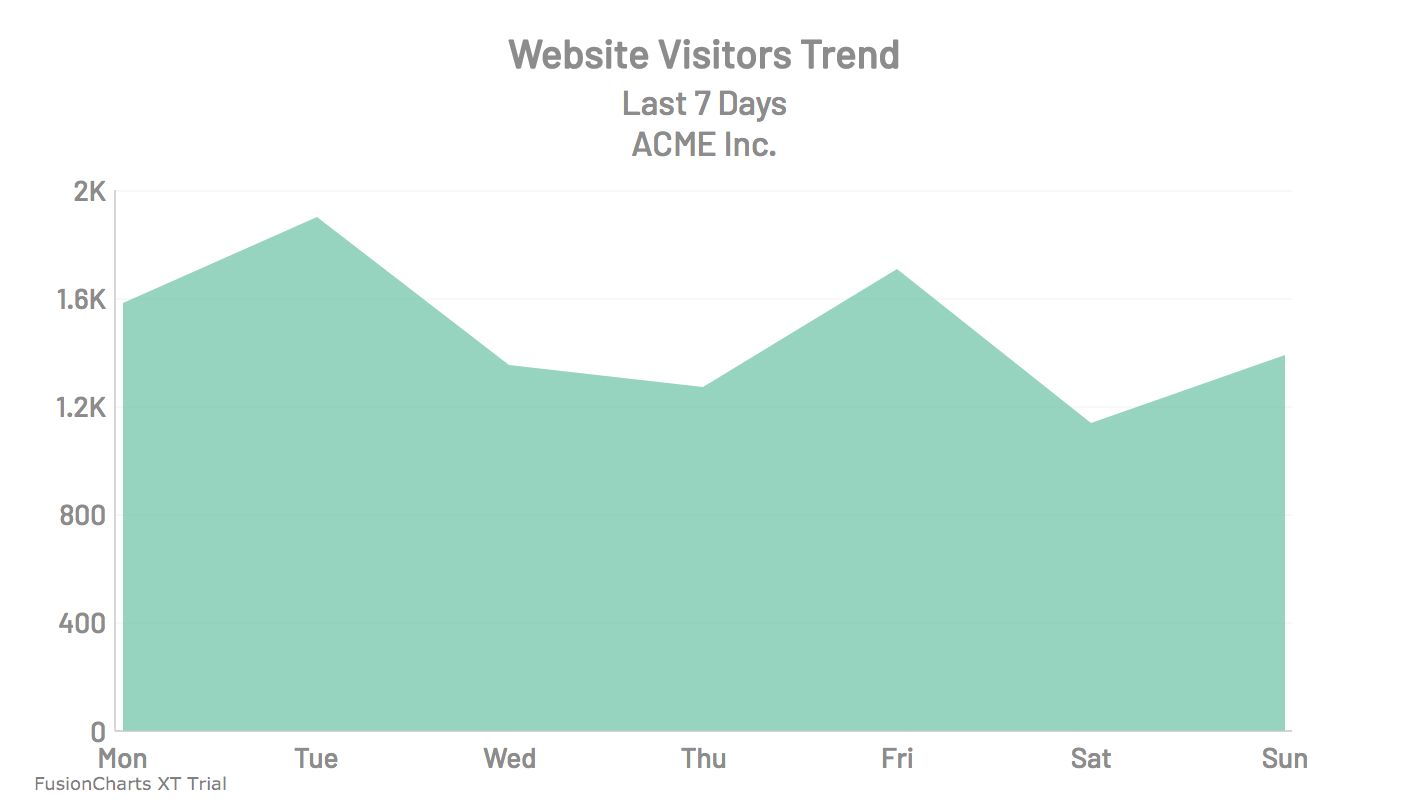
If you are having trouble rendering the chart, you can download the source code for this sample from the GitHub repo.
<!–
The article first appeared here.–>