
Most enterprise apps currently use relational databases like SQL, MariaDB, or MySQL due to their popularity and stable nature. However, developers face issues when they try to scale such databases. Furthermore, considering the recent breed of web applications that handle large data sets, developers are constantly looking for more scalable databases. This has attributed to the rise of non-relational (NoSQL) databases. One such database that has become really popular is MongoDB.
In this tutorial we will follow a step-by-step approach to create charts using data stored in a MongoDB database. We will use the PHP scripting language to connect to the database and fetch the data, which would then be used to render the chart.
We picked PHP over others as it comes with a MongoDB driver that connects it to the database. If you need to add more firepower to your web application, you can also use Node.js.
Table of Contents
Requirements:
For creating charts using PHP and MongoDB, you need the following to be downloaded and installed on your system:
- XAMPP
- MongoDB
- PHP driver for MongoDB
- Composer
Part 1: Including Dependencies
To render FusionCharts in PHP using MongoDB, we need to include following dependencies:
- FusionCharts Suite XT: To begin, you need to download the FusionCharts Suite XT package and store all the extracted script files in a new folder inside the project folder, as shown below.
<html>
   <head>
      <script src="path-to/fusioncharts.js"></script>
      <script src="path-to/fusioncharts.theme.fint.js"></script>
   </head>
</html>
- FusionCharts PHP Wrapper: Extract the FusionCharts PHP Wrapper and save the
fusioncharts.phpfile inside the same folder created in the previous step for keeping the script files.
<?php
    require 'fusioncharts/fusioncharts.php';
?>
- PHP Library for MongoDB (Details ): Include the
autoload.phpfile that is required for using MongoDB with PHP.
<?php
    require 'vendor\autoload.php';
?>
Part 2: Establishing and Validating Database Connection
Once the dependencies are included in our code, we now establish the connection with our database to fetch data for the chart.
<?php
$dbconn = new MongoDB\Client;

if(!$dbconn) {
   exit("There was an error establishing database connection");
}
?>
Part 3: Rendering the Chart
Now that we have established the connection to our database, we will fetch data for our chart.
Let us now look at our chartData collection in the myProject database which we will be using to render the chart.
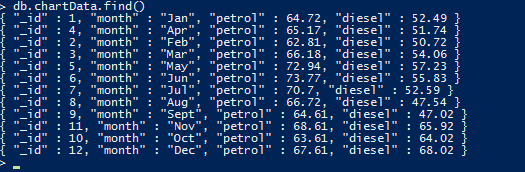
The PHP code for fetching data from our database is as given below:
$db = $dbconn->myProject;
$myObj = $db->chartData->find();

//convert MongoCursor into an array
$data=iterator_to_array($myObj);

// sorting the data
asort($data);
Next, we will use $data to hold the data fetched from our database. We will now form an associative JSON array for the chart.
FusionCharts accepts both XML and JSON data formats. Since we will be using JSON, we will now append the data (fetched from database in the $data variable) along with FusionCharts chart configuration and parse the end result as an associative JSON array.
The PHP code required to append the chart data fetched from the database is given below:
if ($data) {

	$categoryArray=array();

	$dataseries1=array();

	$dataseries2=array();

	foreach ($data as $dataset) {

		array_push($categoryArray, array(
		"label" => $dataset["month"]
		));

		array_push($dataseries1, array(
		"value" => $dataset["petrol"]
		));

		array_push($dataseries2, array(
		"value" => $dataset["diesel"]
		));
	}

	$arrData = array(
		"chart" => array(
			"caption"=> "Comparison of Petrol and Diesel price",
			"xAxisname"=>"Month",
			"yAxisname"=>"Price",
			"numberPrefix"=>"$",
			"paletteColors"=> "#876EA1, #72D7B2",
			"useplotgradientcolor"=> "0",
			"plotBorderAlpha"=> "0",
			"bgColor"=> "#FFFFFFF",
			"canvasBgColor"=> "#FFFFFF",
			"showValues"=> "0",
			"showCanvasBorder"=> "0",
			"showBorder"=> "0",
			"divLineAlpha"=> "40",
			"divLineColor"=> "#DCDCDC",
			"alternateHGridColor"=> "#DCDCDC",
			"alternateHGridAlpha"=> "15",
			"labelDisplay"=> "auto",
			"baseFont"=> "Assistant",
			"baseFontColor"=> "#000000",
			"outCnvBaseFont"=> "Assistant",
			"outCnvBaseFontColor"=> "#000000",
			"baseFontSize"=> "13",
			"outCnvBaseFontSize"=> "13",
			"labelFontColor"=> "#000000",
			"captionFontColor"=> "#153957",
			"captionFontBold"=> "1",
			"captionFontSize"=> "20",
			"subCaptionFontColor"=> "#153957",
			"subCaptionfontSize"=> "17",
			"subCaptionFontBold"=> "0",
			"captionPadding"=> "20",
			"valueFontBold"=> "0",
			"showAxisLines"=> "1",
			"yAxisLineColor"=> "#DCDCDC",
			"xAxisLineColor"=> "#DCDCDC",
			"xAxisLineAlpha"=> "15",
			"yAxisLineAlpha"=> "15",
			"toolTipPadding"=> "7",
			"toolTipBorderColor"=> "#DCDCDC",
			"toolTipBorderThickness"=> "0",
			"toolTipBorderRadius"=> "2",
			"showShadow"=> "0",
			"toolTipBgColor"=> "#153957",
			"toolTipBgAlpha"=> "90",
			"toolTipColor"=> "#FFFFFF",
			"legendBorderAlpha"=> "0",
			"legendShadow"=> "0",
			"legendItemFontSize"=> "14"
		)
	);

	$arrData["categories"]=array(array("category"=>$categoryArray));

	// creating dataset object
	$arrData["dataset"] = array(array("seriesName"=> "Petrol_price", "data"=>$dataseries1), array("seriesName"=> "Diesel_price", "data"=>$dataseries2));

	$jsonEncodedData = json_encode($arrData);
}
Every chart displayed on a web page is rendered within a unique HTML container. We will be using the <div> element for creating the HTML container for our chart.
Given below is the code for creating the chart container:
<body>
   <div id="chart-container">Fusion Charts will render here</div>
</body>
Now that we have the JSON data and chart container in place, we will create the FusionCharts instance and call the render() method to render the chart.
Chart instance includes details needed to render the chart, like the chart type, chart ID, chart dimensions, the HTML container ID, and so on, will be passed to this chart instance.
$msChart = new FusionCharts("msline", "demochart", "600", "400", "chart-container", "json", $jsonEncodedData);
$msChart->render();
If you have been closely following the above steps, then you should see a chart like the image shown below:
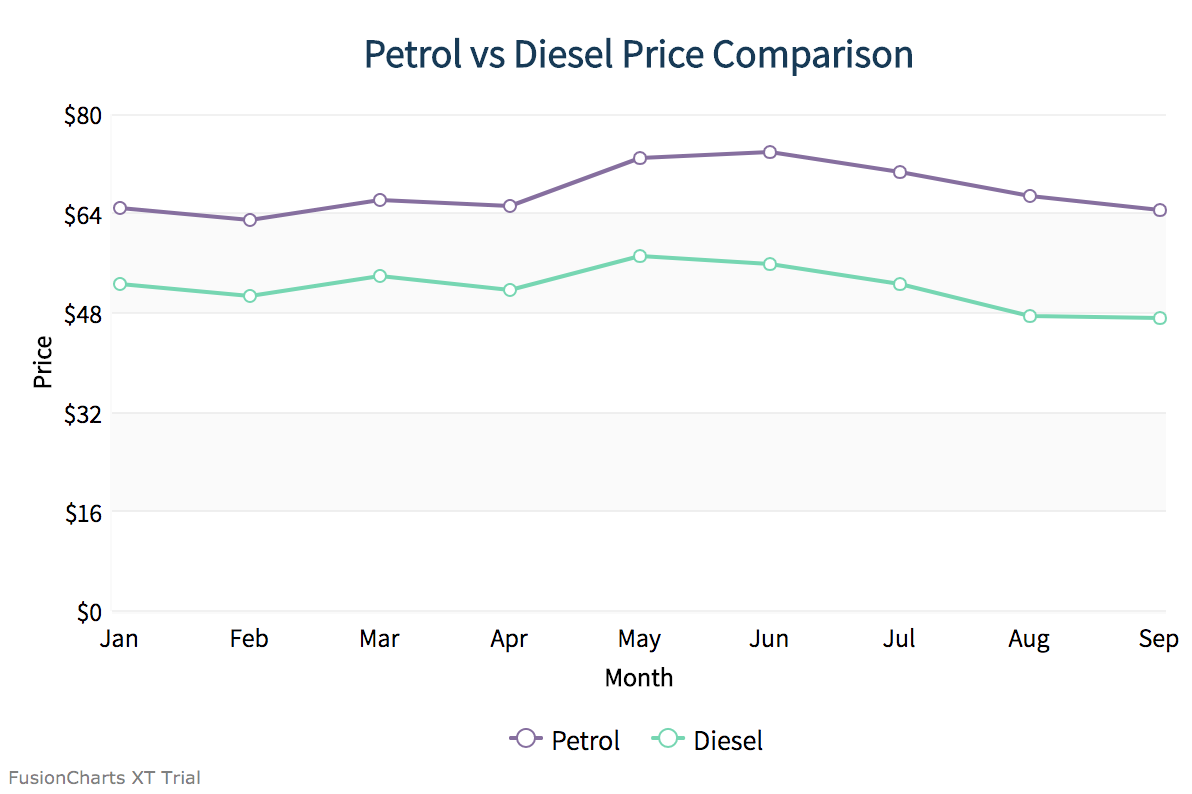
If you are still having trouble rendering the chart, you can view the source code in the Github repo. The article first appeared here.


One response on “How to Create Charts in PHP by Fetching Data from MongoDB 2026”