Dashboards are defined by Wikipedia as “easy-to-read, often single-page, real-time user interfaces that display a graphical representation of the current status and historical trends of an organization’s key performance indicators to enable instantaneous and informed decisions at a glance.”
Assume you frequently interact with dashboards and information systems. In that case, you’d know that at a glance is the keyword here, and it’s a pretty important one, given the number of devices with varying screen resolutions that are available and increasingly used for browsing. This necessitates the use of responsive web design.
FusionCharts suggests a solution for creating responsive business dashboards that are as simple as it gets. From mobile to web and complex reports to modern visualizations, FusionCharts has got you covered with 100+ charts and 2000+ maps to offer.
Continue reading to learn how to create responsive dashboards with fusion charts.
The Problem at Hand
Nowadays, browsing web pages is not only for desktops—smartphones and tablets have caught up. However, if the layout of a website/application is not responsive, browsing on a device smaller than the conventional desktop often needs a lot of re-sizing. Consequently, users find it challenging to navigate through and comprehend the data on the screen.
In the case of dashboards, all the information must fit within one screen; the use of a scroll should be as minimal as possible. Earlier designers could create separate web pages that could render on mobile phones. However, with the present range of devices that users can use to access data, designing consistent resolutions across different kinds of devices is a cumbersome task.
As a result, the viewing experience of a user and the productivity of the organization suffers.
The Solution
FusionCharts Suite XT is a front-end, JavaScript-based charting library. It is a comprehensive collection of simple and complex charts (like the column and bar charts, pie and doughnut charts, treemap, heatmap, logarithmic charts), gauges and widgets (like the angular gauge, bulb gauge, thermometer gauge, and funnel and pyramid charts), and maps (for all continents, major countries, and all US states). All charts in the suite are responsive and can be extensively used to create dashboards for showcasing data across different functions and domains, including Finance, Sales, Marketing, IT, Healthcare, Education, and Government.
All you need is a responsive web layout to add to the visualization experience offered by FusionCharts. FusionCharts is easy to integrate with Bootstrap, a popular front-end framework, for creating responsive dashboards.
Bootstrap is an open-source, front-end web framework used to design web applications and websites. The framework is CSS and written in LESS, which is a style sheet language consisting of variables, functions, and several other techniques to customize your CSS.
Bootstrap comes with a collection of free-to-download and uses templates, simplifying website design significantly. The templates display alongside their source code. Therefore, you can modify the source code to suit your requirements—no coding from scratch is necessary.
Responsiveness to the client device’s screen resolution is Bootstrap’s most robust feature. Merging FusionCharts’ ready-to-use chart samples with Bootstrap’s responsive, ready-to-use templates makes creating dashboards more accessible than ever.
Since Bootstrap plugins are heavily dependent on jQuery, the FusionCharts jQuery plugin can simplify communication between the two.
Example: Creating a Responsive Dashboard with Interactive Charts
The Google Analytics dashboard is an excellent example of how dashboards should be and what information they communicate. However, the dashboard is not responsive, which makes it challenging to view mobile devices.
We would like to demonstrate how you can use Bootstrap and FusionCharts together to create impressive and responsive dashboards. Let’s reproduce one part of the Google Analytics dashboard and make it responsive, as shown in the image below:
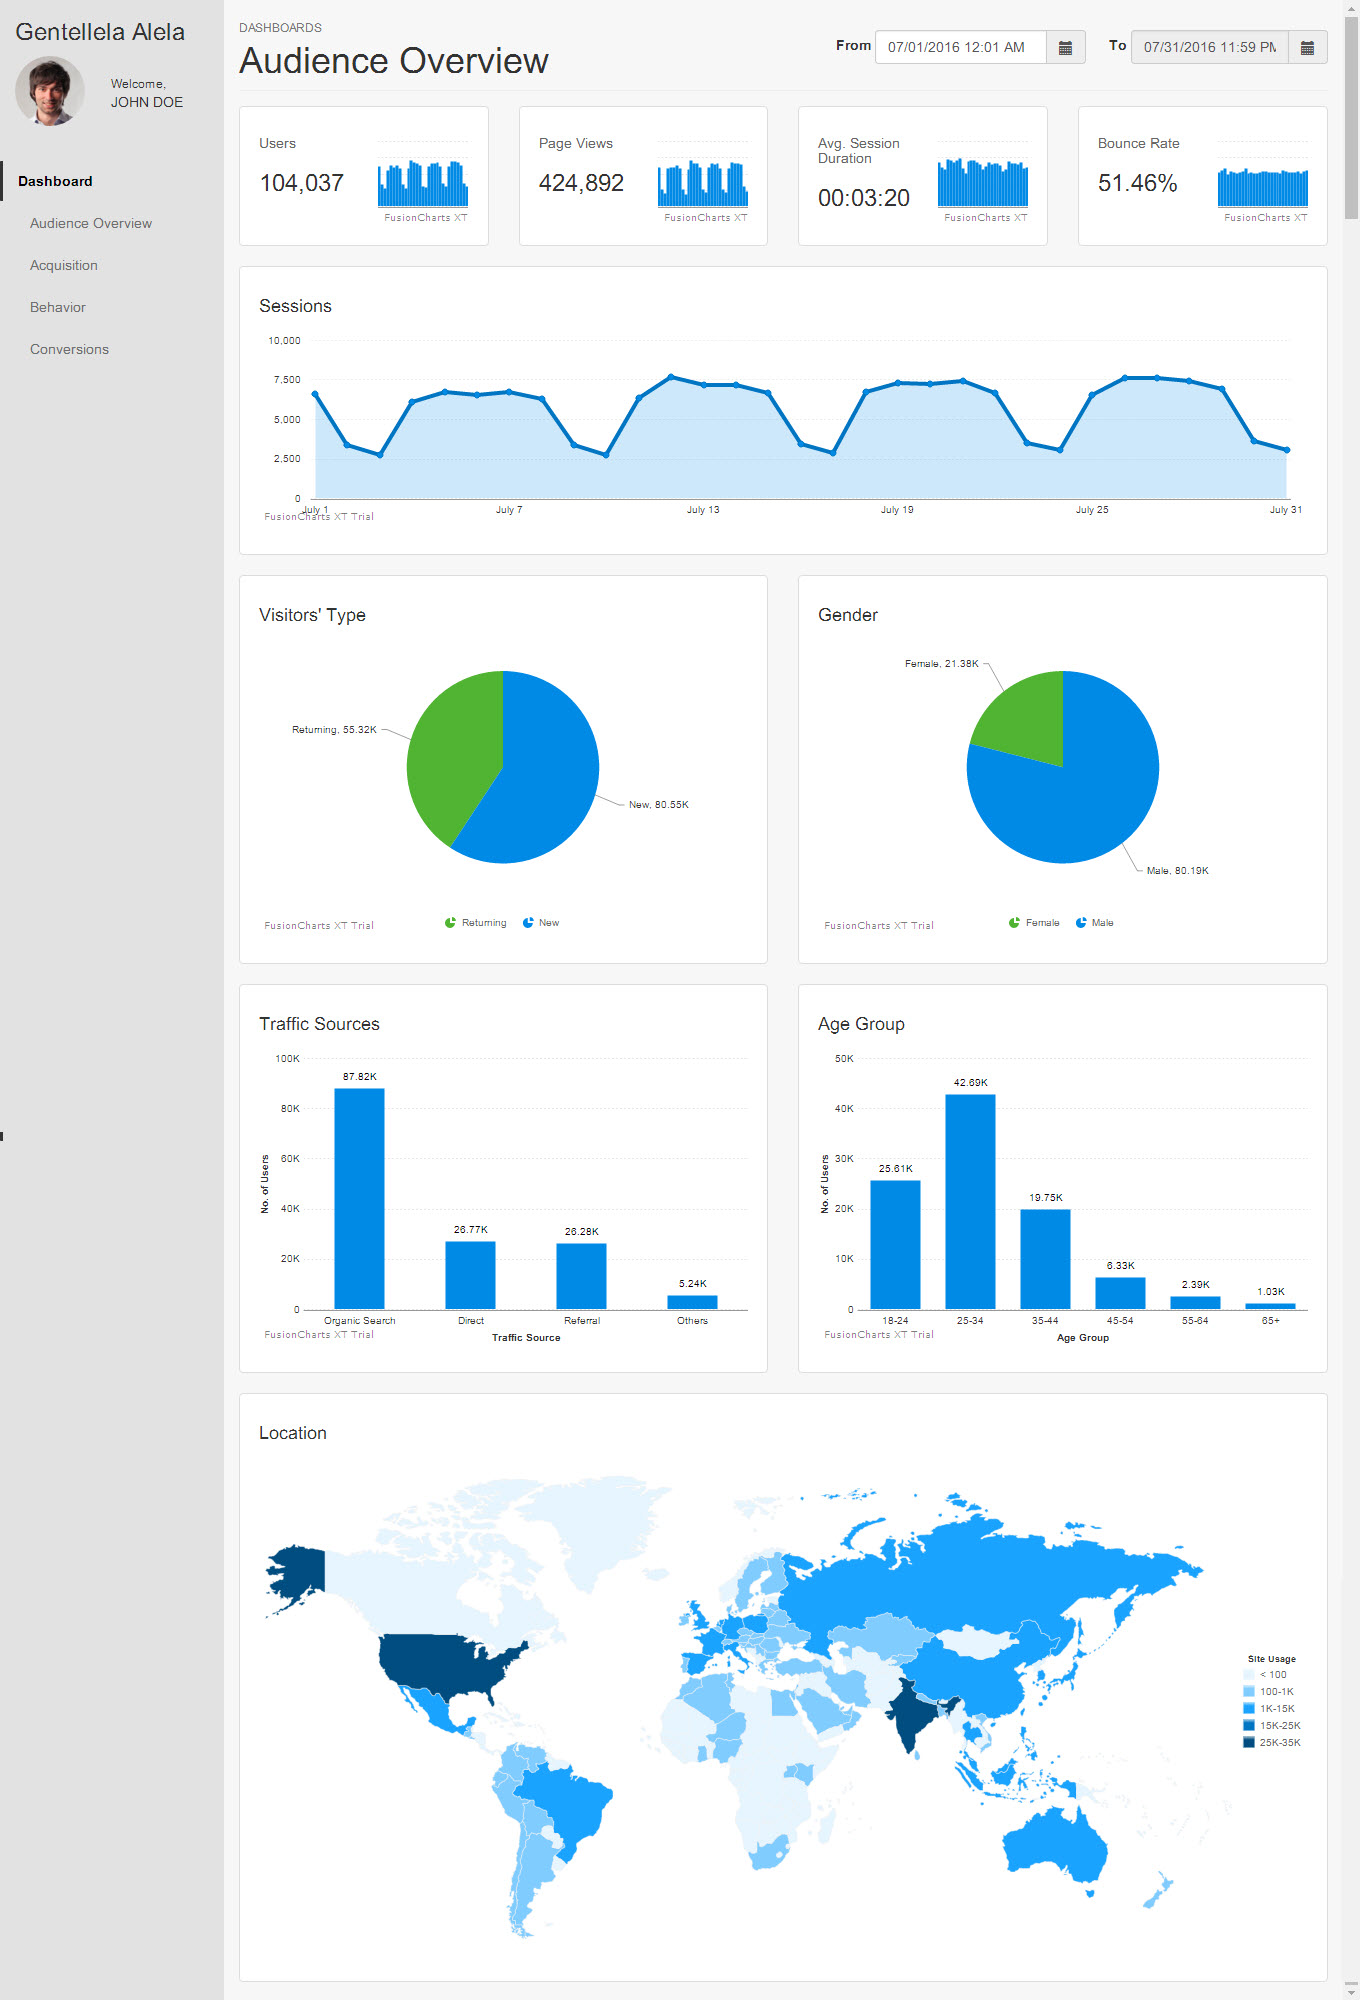
The Google Analytics dashboard gives website owners a holistic view of the website traffic statistics. The dashboard gives you traffic information for a specified duration, including the total number of visitors for that duration, traffic classification (based on visitor type, gender, age group, traffic source, and location), etc.
The FusionCharts jQuery plugin with the Bootstrap library is helpful in creating the dashboard. Using FusionCharts lets you pick the right chart type for showcasing specific kinds of data. Bootstrap facilitates creating a responsive dashboard that can render and work consistently across all platforms and browsers.
Click here to view the dashboard in action. Try rendering it on devices with different screen resolutions to see how the dashboard layout adapts to the current screen resolution.
The images below are partial screenshots showing how the dashboard layout readjusts to fit in on a phone and an iPad.