In 2022 the FusionCharts blog had thousands of page views. This reaffirms the cohesion among the FusionCharts community and the strong interest that our product updates and explorations of FusionCharts’ capabilities generate among developers.
So which of the blog posts of 2022 drew the most attention? To compile this list, we chose the best posts and highlighted the gems using GA data.
Below, you will find a curated selection of our most popular blog posts pertaining to product releases and updates from the year 2022.
Table of Contents
Table of Content
- React Native Component for FusionCharts 5.2.0 Is Available
- Meet FusionGrid!
- How to Create a Pie Chart in PHP and MySQL
- New Release: Meet FusionCharts 3.19 and FusionTime 2.7!
- 13 of the Best React Chart Libraries In 2022
- Top Notch Open Source JS Chart Library for 2022
- How to Do Business Dashboards
- Top 20 JavaScript Libraries for Data Visualization for 2022
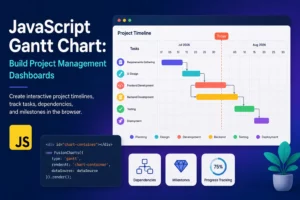
- How to Create a Flow Chart in JavaScript
- The Best Kept Secrets about React Charts
1. React Native Component for FusionCharts 5.2.0 Is Available

The FusionCharts React Native Component was rewritten from scratch to provide the best performance and experience for React Native developers using FusionCharts in their applications. This release also addresses some customer-reported tickets in the rendering of FusionCharts in Expo.
You can now use the React Native Component with FusionCharts 3.18.0 and above.
2. Meet FusionGrid!
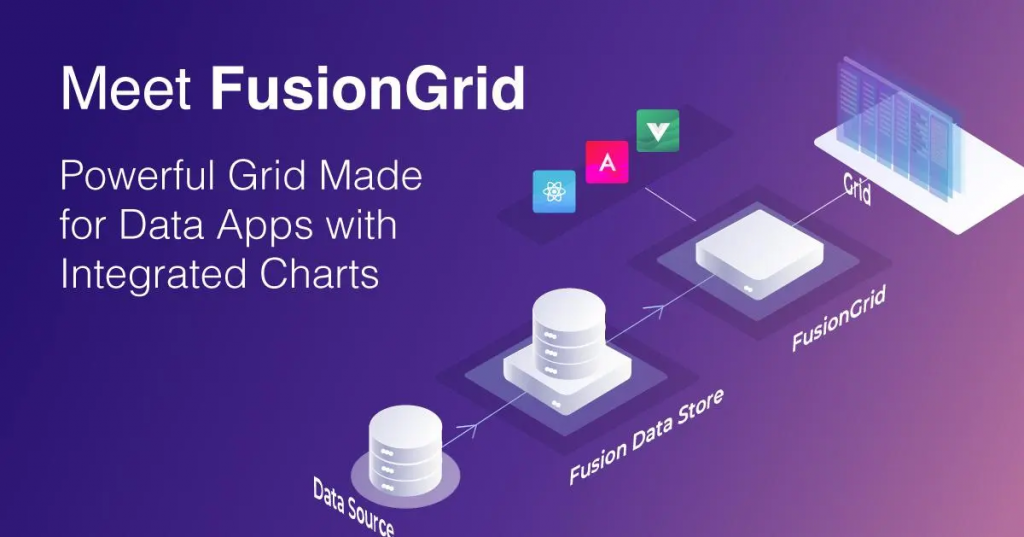
FusionGrid is a highly intuitive and customizable JavaScript data grid component for both web and mobile applications. It allows you to build data grids in dashboards with the same simplicity and elegance as FusionCharts.
With the introduction of FusionGrid, you no longer need to look outside of the FusionCharts product portfolio to find a suitable grid solution. FusionGrid is designed to work with the same data store you are already using with FusionCharts, making it the perfect addition to your dashboard needs.
3. How to Create a Pie Chart in PHP and MySQL

PHP is one of the most common server-side scripting languages developers worldwide use for web development. When it comes to creating a PHP chart using data contained in a database, most developers prefer the MySQL database. MySQL, an open-source RDBMS (Relational Database Management System), helps automate the process of retrieving data. Using PHP and MySQL together, developers can build just about any type of website, simple or complex. For example, you can create a pie chart in PHP and MySQL to display proportion/relative data on your website/web app.
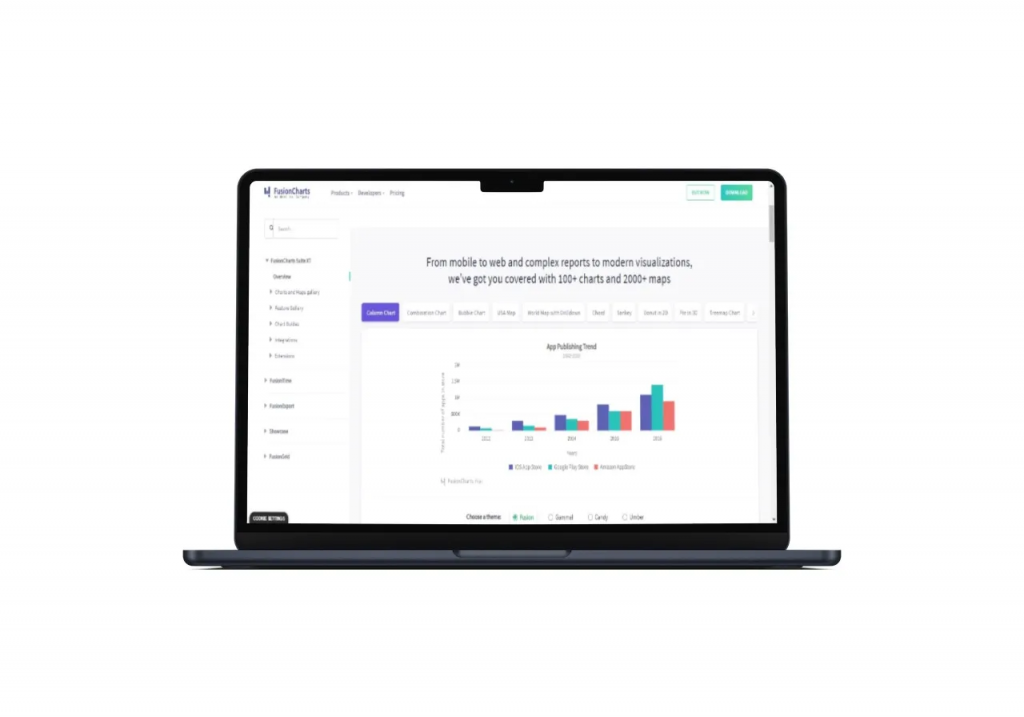
4. New Release: Meet FusionCharts 3.19 and FusionTime 2.7!

FusionCharts makes it easy for developers to create beautiful charts for web and mobile platforms. Today we are excited to announce the FusionCharts 3.19 and FusionTime 2.7 release!
This release includes many highly requested features, enhancements, and quality improvements, making our charts more robust, accessible, and user-friendly.
5. 13 of the Best React Chart Libraries In 2022

According to statistics, humans produce about 2.5 quintillion bytes of data daily. And businesses today look to leverage this data to keep up with constantly evolving consumer expectations. This involves quickly understanding complex data and making data-driven decisions. However, we are visual creatures. Data, in itself, could be more visually appealing and, therefore, can be difficult to understand. But what if it wasn’t? React chart libraries let you quickly represent complex data in a visually compelling manner that’s easy to understand, Thereby enabling faster decision-making processes, which is imperative for survival in our fast-paced world.
However, the React chart library market is over-saturated, and finding the best fit for your project can be overwhelming. We’ve created this list of high-quality chart libraries to inform your research.
6. Top Notch Open Source JS Chart Library for 2022
As a developer, you must have created charts to visualize the data. You use a JavaScript chart library to easily create different types of visualizations, like line graphs, bar graphs, area charts, etc. It contains all the necessary functions. Hence, you don’t have to do anything from scratch. It makes your development process faster. There are lots of visualization libraries available online. But which are the best ones? In this post, you will find 10 top-notch open-source JS chart libraries for 2022.
7. How to Do Business Dashboards
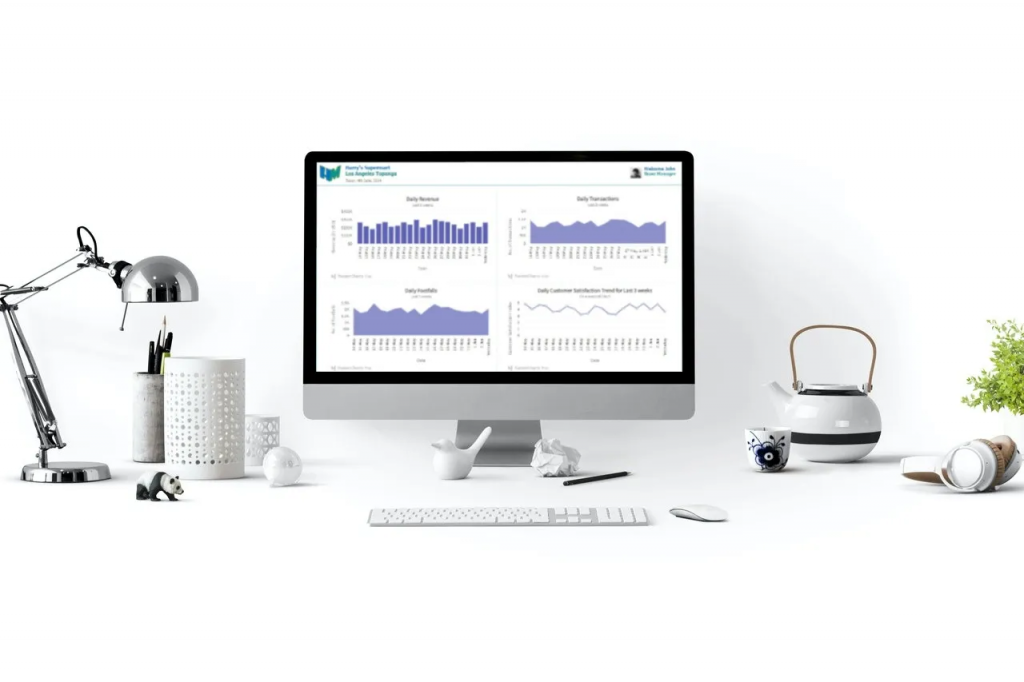
Business dashboards allow you to track the important metrics of your organization. They help you uncover key insights and make effective data-driven decisions. But how can you easily create a business dashboard? Is there a way to quickly visualize your data using beautiful charts? In this post, you will find all the details.
8. Top 20 JavaScript Libraries for Data Visualization for 2022

Data visualization is undoubtedly the most important task in any data-driven business. It allows data to be better understood at a glance and can also help uncover hidden trends or patterns that might not be apparent. There are many different ways to visualize data; however, choosing the right approach can be tricky. In addition, many JavaScript libraries for data visualization make it very hard to choose the right data visualization tool.
9. How to Create a Flow Chart in JavaScript
In the realm of information technology, there are hundreds of programming languages. Although most programming languages have the same syntax, each has its own set of characteristics. Naturally, some programming languages specialize in front-end application development, while others focus on backend development. JavaScript is one of the few languages that work for both purposes and is a popular choice for a JavaScript flow chart. Moreover, it is possibly the most versatile programming language. The progression of this language over time is pretty spectacular, which is why the importance of JavaScript is growing over time. Naturally, the functionalities it provides make it a favorite amongst developers for data visualization. Creating a flow chart in JavaScript is one example.
FusionCharts Suite allows you to customize your chart in any way you want, whether functional or decorative. Moreover, you can customize the charts with properties, add layers with annotations, or create complicated visualizations with our events and API. This article will focus on how to make a JavaScript flow chart using FusionCharts.
10. The Best Kept Secrets about React Charts
React is one of the most popular open-source JavaScript libraries for building user interfaces. It is an excellent candidate for handling the view layer of any modern web or mobile application.
The best part is that React is easily integrated with other frameworks and technologies to address many front-end development requirements. React enables developers to create interactive interfaces without the need to reload the page. This feature is the key to creating beautiful, intuitive, performance-centric interfaces. However, graphs and charts are one UI component that can be complex to implement correctly with React. In this post, let’s look at some facts about React charts that you might not know.
There you have it, the top 10 most-read blog posts of 2022. Enjoy reading them again. Expect more great content from FusionCharts in 2023!