Keeping track of investment accounts is not an easy task. That’s why investors around the world prefer to use the investment dashboard. It provides them with a quick overview of the estimated return rate. The Venture Capital firms also use the dashboard that is specifically built for their businesses. It enables them to oversee and manage all of their investments conveniently. You can help investors and venture capital firms by creating powerful investment and venture financing dashboards using FusionCharts. In this post, you will find all the details about building a financial dashboard.
Table of Contents
What is FusionCharts?
FusionCharts is a JavaScript library for generating clean and dynamic charts, gauges, or maps in web applications. It supports over 100 charts and 2000 maps. So, you have the flexibility of visualizing the data in any way you like.
How to Build Powerful Investment Financing Dashboards with FusionCharts and Angular
Angular is a component-based framework for building mobile and web applications. By using it with FusionCharts, you can build powerful investment financing dashboards easily. Take a look at this example:
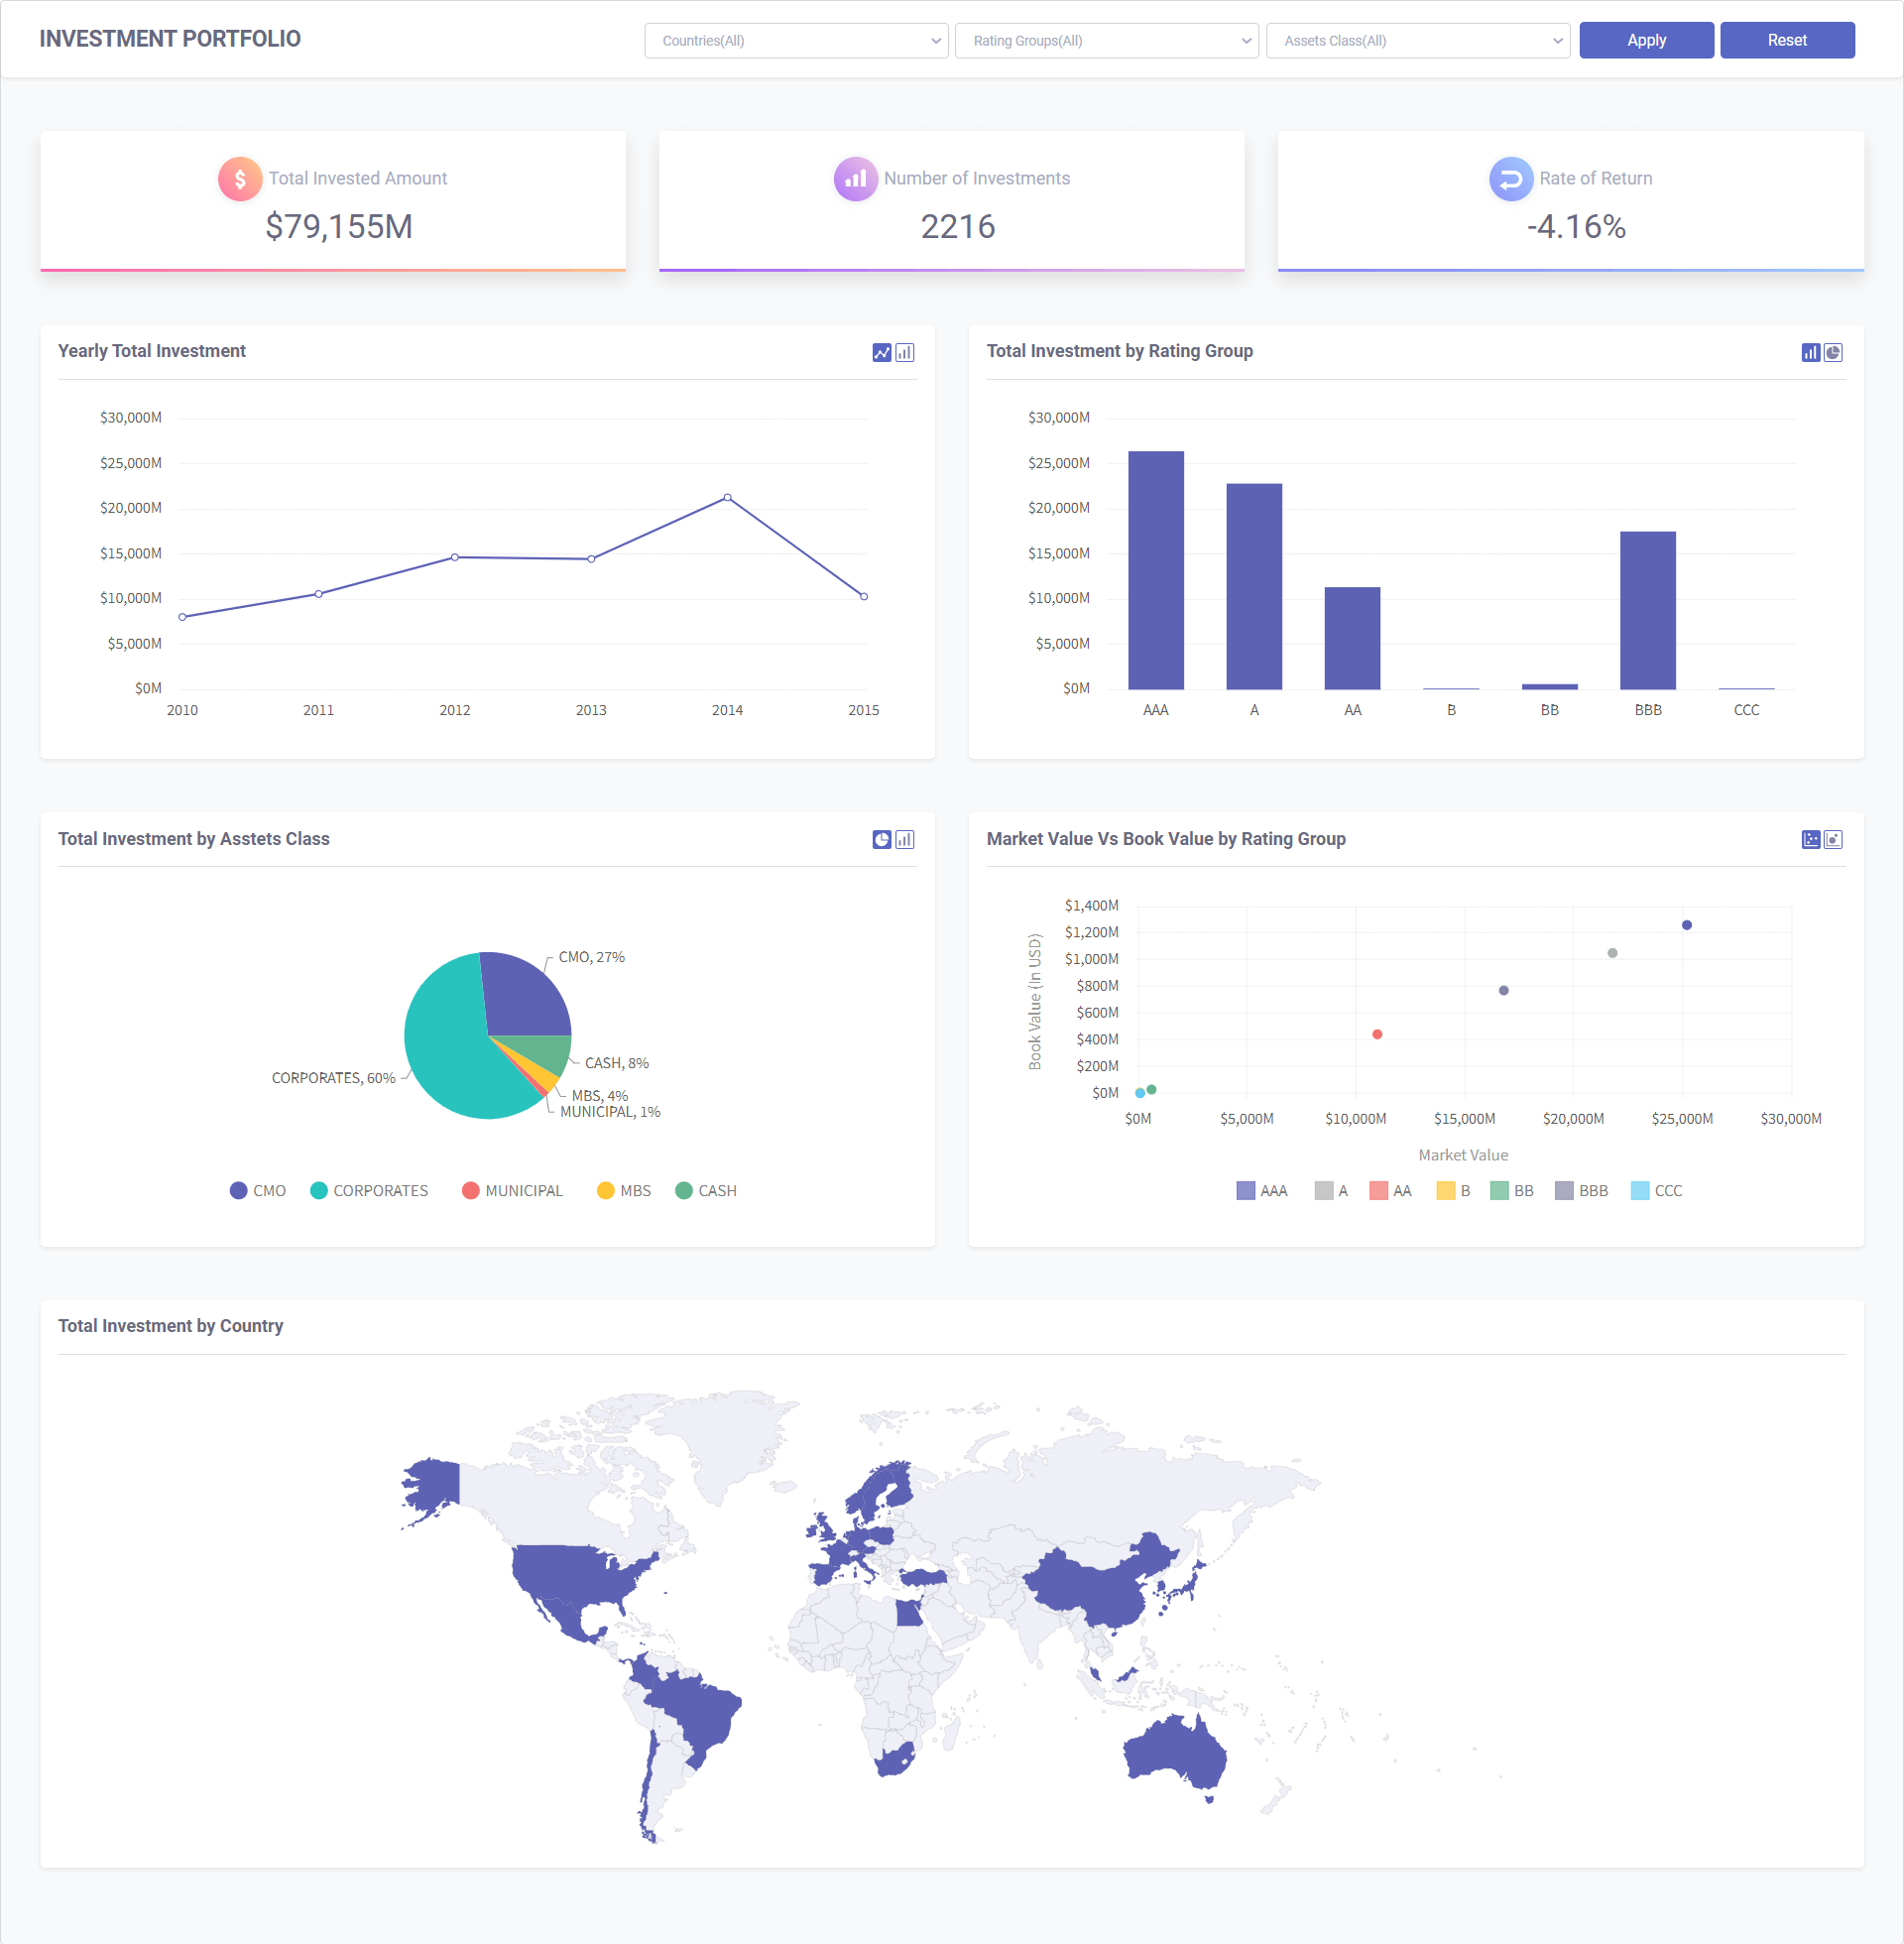
To create the investment financing dashboard shown above, you have to follow these steps:
1. First, you have to create the components for your dashboard. Navigate to src > app folder. Create a new file, called app.component.ts. Then add these codes:
import { Component, AfterViewInit } from '@angular/core';
import { Injectable } from '@angular/core';
import { Renderer } from '@angular/core';
import { environment } from '../environments/environment';
import * as FusionCharts from 'fusioncharts';
import { PieComponent } from '../../VisualizationTemplate/PieChart';
import { LineComponent } from '../../VisualizationTemplate/LineChart';
import { ColumnComponent } from '../../VisualizationTemplate/ColumnChart';
import { WorldMapComponent } from '../../VisualizationTemplate/WorldMap';
import { ScatterChartComponent } from '../../VisualizationTemplate/ScatterChart';
import { UiComponent } from '../../VisualizationTemplate/UiComponent';
import { KpiComponent } from '../../VisualizationTemplate/KPI';
import { HttpClient } from '@angular/common/http';
import { CommonUtils } from '../../Data/CommonUtils';
@Component({
  selector: 'app-root',
  templateUrl: './app.component.html',
  styleUrls: ['./app.component.css']
})
@Injectable()
export class DataStoreComponent {
  title = 'INVESTMENT PORTFOLIO';
  lineChartHeader = 'Yearly Total Investment';
  pieChartHeader = 'Total Investment by Asstets Class';
  columnChartHeader = 'Total Investment by Rating Group';
  scatterChartHeader = 'Market Value Vs Book Value by Rating Group';
  mapHeader = 'Total Investment by Country';
  rorClass: string;
  totalInvestMent: string;
  investmentCount: number;
  rateOfReturn: string;
  countries: string[];
  allRatinggroups: string[];
  allAssetclass: string[];
  linechartdata = {};
  columnchartdata = {};
  piechartdata = {};
  scatterchartdata = {};
  worldmapdata = {};
  selectedCountry: string;
  selectedClass: string;
  selectedRatingGroup: string;
  baseUrl = environment.baseUrl;
  constructor(private httpClient: HttpClient, private renderer: Renderer) {
    this.selectedCountry = 'Countries(All)';
    this.selectedClass = 'Assets Class(All)';
    this.selectedRatingGroup = 'Rating Groups(All)';
    this.totalInvestMent = KpiComponent.TotalInvestment('', '', '');
    this.rateOfReturn = KpiComponent.RateOfReturn('', '', '');
    if (CommonUtils.NumberFormat(this.rateOfReturn) === 0) {
      // this.rorClass = 'fc-kpi-arrow-contaier fas fa-long-arrow-alt-neutral';
      this.rateOfReturn = this.rateOfReturn.replace('-', '');
      this.rateOfReturn = this.rateOfReturn.replace('+', '');
    }/* else if (this.rateOfReturn.substring(0, 1) === '-') {
      this.rorClass = 'fc-kpi-arrow-contaier fas fa-long-arrow-alt-down';
      this.rateOfReturn = this.rateOfReturn.replace('-', '');
    } else {
      this.rorClass = 'fc-kpi-arrow-contaier fas fa-long-arrow-alt-up';
    } */
    this.investmentCount = KpiComponent.NumberOfInvestment('', '', '');
    this.countries = UiComponent.GetAllCountries();
    this.allRatinggroups = UiComponent.GetAllGroup();
    this.allAssetclass = UiComponent.GetAllClass();
    this.piechartdata = PieComponent.ChartJson('', '', '');
    this.linechartdata = LineComponent.ChartJson('', '', '');
    this.columnchartdata = ColumnComponent.ChartJson('', '', '');
    this.scatterchartdata = ScatterChartComponent.ChartJson('', '', '');
    this.worldmapdata = WorldMapComponent.ChartJson('', '', '');
  }
  // tslint:disable-next-line:use-lifecycle-interface
  ngAfterViewInit(): void {
    this.InitializeSelectedClass();
  }
  onApplyFilter(): void {
    this.totalInvestMent = KpiComponent.TotalInvestment(this.selectedCountry, this.selectedClass, this.selectedRatingGroup);
    this.investmentCount = KpiComponent.NumberOfInvestment(this.selectedCountry, this.selectedClass, this.selectedRatingGroup);
    this.rateOfReturn = KpiComponent.RateOfReturn(this.selectedCountry, this.selectedClass, this.selectedRatingGroup);
    this.piechartdata = PieComponent.ChartJson(this.selectedCountry, this.selectedClass, this.selectedRatingGroup);
    this.linechartdata = LineComponent.ChartJson(this.selectedCountry, this.selectedClass, this.selectedRatingGroup);
    this.columnchartdata = ColumnComponent.ChartJson(this.selectedCountry, this.selectedClass, this.selectedRatingGroup);
    this.worldmapdata = WorldMapComponent.ChartJson(this.selectedCountry, this.selectedClass, this.selectedRatingGroup);
    this.scatterchartdata = ScatterChartComponent.ChartJson(this.selectedCountry, this.selectedClass, this.selectedRatingGroup);
    if (CommonUtils.NumberFormat(this.rateOfReturn) === 0) {
      // this.rorClass = 'fc-kpi-arrow-contaier fas fa-long-arrow-alt-neutral';
      this.rateOfReturn = this.rateOfReturn.replace('-', '');
      this.rateOfReturn = this.rateOfReturn.replace('+', '');
    }/* else if (this.rateOfReturn.substring(0, 1) === '-') {
      this.rorClass = 'fc-kpi-arrow-contaier fas fa-long-arrow-alt-down';
      this.rateOfReturn = this.rateOfReturn.replace('-', '');
    } else {
      this.rorClass = 'fc-kpi-arrow-contaier fas fa-long-arrow-alt-up';
    } */
  }
  onResetFilter(): void {
    this.totalInvestMent = KpiComponent.TotalInvestment('', '', '');
    this.investmentCount = KpiComponent.NumberOfInvestment('', '', '');
    this.rateOfReturn = KpiComponent.RateOfReturn('', '', '');
    this.piechartdata = PieComponent.ChartJson('', '', '');
    this.linechartdata = LineComponent.ChartJson('', '', '');
    this.columnchartdata = ColumnComponent.ChartJson('', '', '');
    this.worldmapdata = WorldMapComponent.ChartJson('', '', '');
    this.scatterchartdata = ScatterChartComponent.ChartJson('', '', '');
    this.selectedCountry = 'Countries(All)';
    this.selectedClass = 'Assets Class(All)';
    this.selectedRatingGroup = 'Rating Groups(All)';
    if (CommonUtils.NumberFormat(this.rateOfReturn) === 0) {
      // this.rorClass = 'fc-kpi-arrow-contaier fas fa-long-arrow-alt-neutral';
      this.rateOfReturn = this.rateOfReturn.replace('-', '');
      this.rateOfReturn = this.rateOfReturn.replace('+', '');
    }/* else if (this.rateOfReturn.substring(0, 1) === '-') {
      this.rorClass = 'fc-kpi-arrow-contaier fas fa-long-arrow-alt-down';
      this.rateOfReturn = this.rateOfReturn.replace('-', '');
    } else {
      this.rorClass = 'fc-kpi-arrow-contaier fas fa-long-arrow-alt-up';
    } */
  }
  PieChange(chart) {
    if (chart === 'pie2d') {
      const ctlid = 'toggle-pie';
      const addClass = 'fc-pie-selected-icon';
      const removeClass = 'fc-pie-icon';
      const addClassToggle = 'fc-column-icon';
      const removeClassToggle = 'fc-column-selected-icon';
      this.AddSelectedClass(ctlid, event.target, addClass, removeClass, addClassToggle, removeClassToggle);
    } else {
      const ctlid = 'pie';
      const addClass = 'fc-column-selected-icon';
      const removeClass = 'fc-column-icon';
      const addClassToggle = 'fc-pie-icon';
      const removeClassToggle = 'fc-pie-selected-icon';
      this.AddSelectedClass(ctlid, event.target, addClass, removeClass, addClassToggle, removeClassToggle);
    }
    PieComponent.ChangeType(chart);
  }
  PieInitialized($event) {
    PieComponent.Initialized($event);
  }
  InitializeSelectedClass() {
    const controls: string[] = ['line', 'column', 'pie', 'scatter'];
    // tslint:disable-next-line:prefer-for-of
    for (let i = 0; i < controls.length; i++) {
      const ctl = document.getElementById(controls[i]);
      this.renderer.setElementClass(ctl, 'fc-' + controls[i] + '-selected-icon', true);
    }
  }
  AddSelectedClass(ctrl, target, addClass, removeClass, addClassToToggle, removeClassToToggle) {
    const ctl = document.getElementById(ctrl);
    this.renderer.setElementClass(event.target, addClass, true);
    this.renderer.setElementClass(event.target, removeClass, false);
    this.renderer.setElementClass(ctl, addClassToToggle, true);
    this.renderer.setElementClass(ctl, removeClassToToggle, false);
  }
  LineChange(chart) {
    if (chart === 'line') {
      const ctlid = 'toggle-line';
      const addClass = 'fc-line-selected-icon';
      const removeClass = 'fc-line-icon';
      const addClassToggle = 'fc-column-icon';
      const removeClassToggle = 'fc-column-selected-icon';
      this.AddSelectedClass(ctlid, event.target, addClass, removeClass, addClassToggle, removeClassToggle);
    } else {
      const ctlid = 'line';
      const addClass = 'fc-column-selected-icon';
      const removeClass = 'fc-column-icon';
      const addClassToggle = 'fc-line-icon';
      const removeClassToggle = 'fc-line-selected-icon';
      this.AddSelectedClass(ctlid, event.target, addClass, removeClass, addClassToggle, removeClassToggle);
    }
    LineComponent.ChangeType(chart);
  }
  LineInitialized($event) {
    LineComponent.Initialized($event);
  }
  ColumnChange(chart) {
    if (chart === 'column2d') {
      const ctlid = 'toggle-column';
      const addClass = 'fc-column-selected-icon';
      const removeClass = 'fc-column-icon';
      const addClassToggle = 'fc-pie-icon';
      const removeClassToggle = 'fc-pie-selected-icon';
      this.AddSelectedClass(ctlid, event.target, addClass, removeClass, addClassToggle, removeClassToggle);
    } else {
      const ctlid = 'column';
      const addClass = 'fc-pie-selected-icon';
      const removeClass = 'fc-pie-icon';
      const addClassToggle = 'fc-column-icon';
      const removeClassToggle = 'fc-column-selected-icon';
      this.AddSelectedClass(ctlid, event.target, addClass, removeClass, addClassToggle, removeClassToggle);
    }
    ColumnComponent.ChangeType(chart);
  }
  ColumnInitialized($event) {
    ColumnComponent.Initialized($event);
  }
  ScatterChange(chart) {
    if (chart === 'scatter') {
      this.scatterChartHeader = 'Market Value Vs Book Value by Rating Group';
      const ctlid = 'bubble';
      const addClass = 'fc-scatter-selected-icon';
      const removeClass = 'fc-scatter-icon';
      const addClassToggle = 'fc-bubble-icon';
      const removeClassToggle = 'fc-bubble-selected-icon';
      this.AddSelectedClass(ctlid, event.target, addClass, removeClass, addClassToggle, removeClassToggle);
    } else {
      this.scatterChartHeader = 'Market Value,Book Value and Revenue by Rating Group';
      const ctlid = 'scatter';
      const addClass = 'fc-bubble-selected-icon';
      const removeClass = 'fc-bubble-icon';
      const addClassToggle = 'fc-scatter-icon';
      const removeClassToggle = 'fc-scatter-selected-icon';
      this.AddSelectedClass(ctlid, event.target, addClass, removeClass, addClassToggle, removeClassToggle);
    }
    this.scatterchartdata = ScatterChartComponent.ChangeType(chart, this.selectedCountry, this.selectedClass, this.selectedRatingGroup);
  }
  ScatterInitialized($event) {
    ScatterChartComponent.Initialized($event);
  }
}
Here, you are defining methods for various functionalities, like displaying pie charts and line charts.
2. Next, you have to create component specs. Create app.component.spec.ts file. Insert these lines:
import { TestBed, async } from '@angular/core/testing';
import { RouterTestingModule } from '@angular/router/testing';
import { DataStoreComponent } from './app.component';
describe('AppComponent', () => {
  beforeEach(async(() => {
    TestBed.configureTestingModule({
      imports: [
        RouterTestingModule
      ],
      declarations: [
        DataStoreComponent
      ],
    }).compileComponents();
  }));
  it('should create the app', () => {
    const fixture = TestBed.createComponent(DataStoreComponent);
    const app = fixture.debugElement.componentInstance;
    expect(app).toBeTruthy();
  });
  it(`should have as title 'InvestmentPortfolio'`, () => {
    const fixture = TestBed.createComponent(DataStoreComponent);
    const app = fixture.debugElement.componentInstance;
    expect(app.title).toEqual('InvestmentPortfolio');
  });
  it('should render title in a h1 tag', () => {
    const fixture = TestBed.createComponent(DataStoreComponent);
    fixture.detectChanges();
    const compiled = fixture.debugElement.nativeElement;
    expect(compiled.querySelector('h1').textContent).toContain('Welcome to InvestmentPortfolio!');
  });
});
3. Now, you have to import the required modules for your dashboard. Create app.module.ts file and insert these codes:
import { BrowserModule } from '@angular/platform-browser';
import { NgModule, enableProdMode} from '@angular/core';
import { FormsModule } from '@angular/forms';
import { AppRoutingModule } from './app-routing.module';
import { DataStoreComponent } from './app.component';
import { FusionChartsModule } from 'angular-fusioncharts';
import * as FusionCharts from 'fusioncharts';
import * as Charts from 'fusioncharts/fusioncharts.charts';
import * as FusionMaps from 'fusioncharts/fusioncharts.maps';
import * as World from 'fusioncharts/maps/fusioncharts.world';
import * as FusionTheme from 'fusioncharts/themes/fusioncharts.theme.fusion';
import * as Countries from 'fusionmaps/maps/fusioncharts.worldwithcountries';
import {HttpClientModule} from '@angular/common/http';
FusionChartsModule.fcRoot(FusionCharts, Charts, FusionTheme, World, FusionMaps, Countries);
@NgModule({
  declarations: [
    DataStoreComponent
  ],
  imports: [
    BrowserModule,
    HttpClientModule,
    AppRoutingModule,
    FormsModule,
    FusionChartsModule
  ],
  providers: [],
  bootstrap: [DataStoreComponent]
})
export class AppModule { }
Here, you are importing various modules, including FusionChartsModule and NgModule.
4. Then you have to define the routing. Create the app-routing.module.ts file and add these codes:
import { NgModule } from '@angular/core';
import { Routes, RouterModule } from '@angular/router';
const routes: Routes = [];
@NgModule({
  imports: [RouterModule.forRoot(routes)],
  exports: [RouterModule]
})
export class AppRoutingModule { }
5. Create json-typings.d.ts file and insert these lines:
declare module "*.json" {
    const value: any;

    export default value;

 }
Source Code
If you need help, you can download the source code from here.
Once the download is done, unzip the file. Then navigate through investment-portfolio > src folder. Here, you will find the source code of the investment dashboard.
How to Build Powerful Venture Financing Dashboards with FusionCharts and React
You can utilize the power of React and FusionCharts to create Venture Financing dashboards quickly and conveniently. Take a look at this beautiful dashboard created for venture financing:
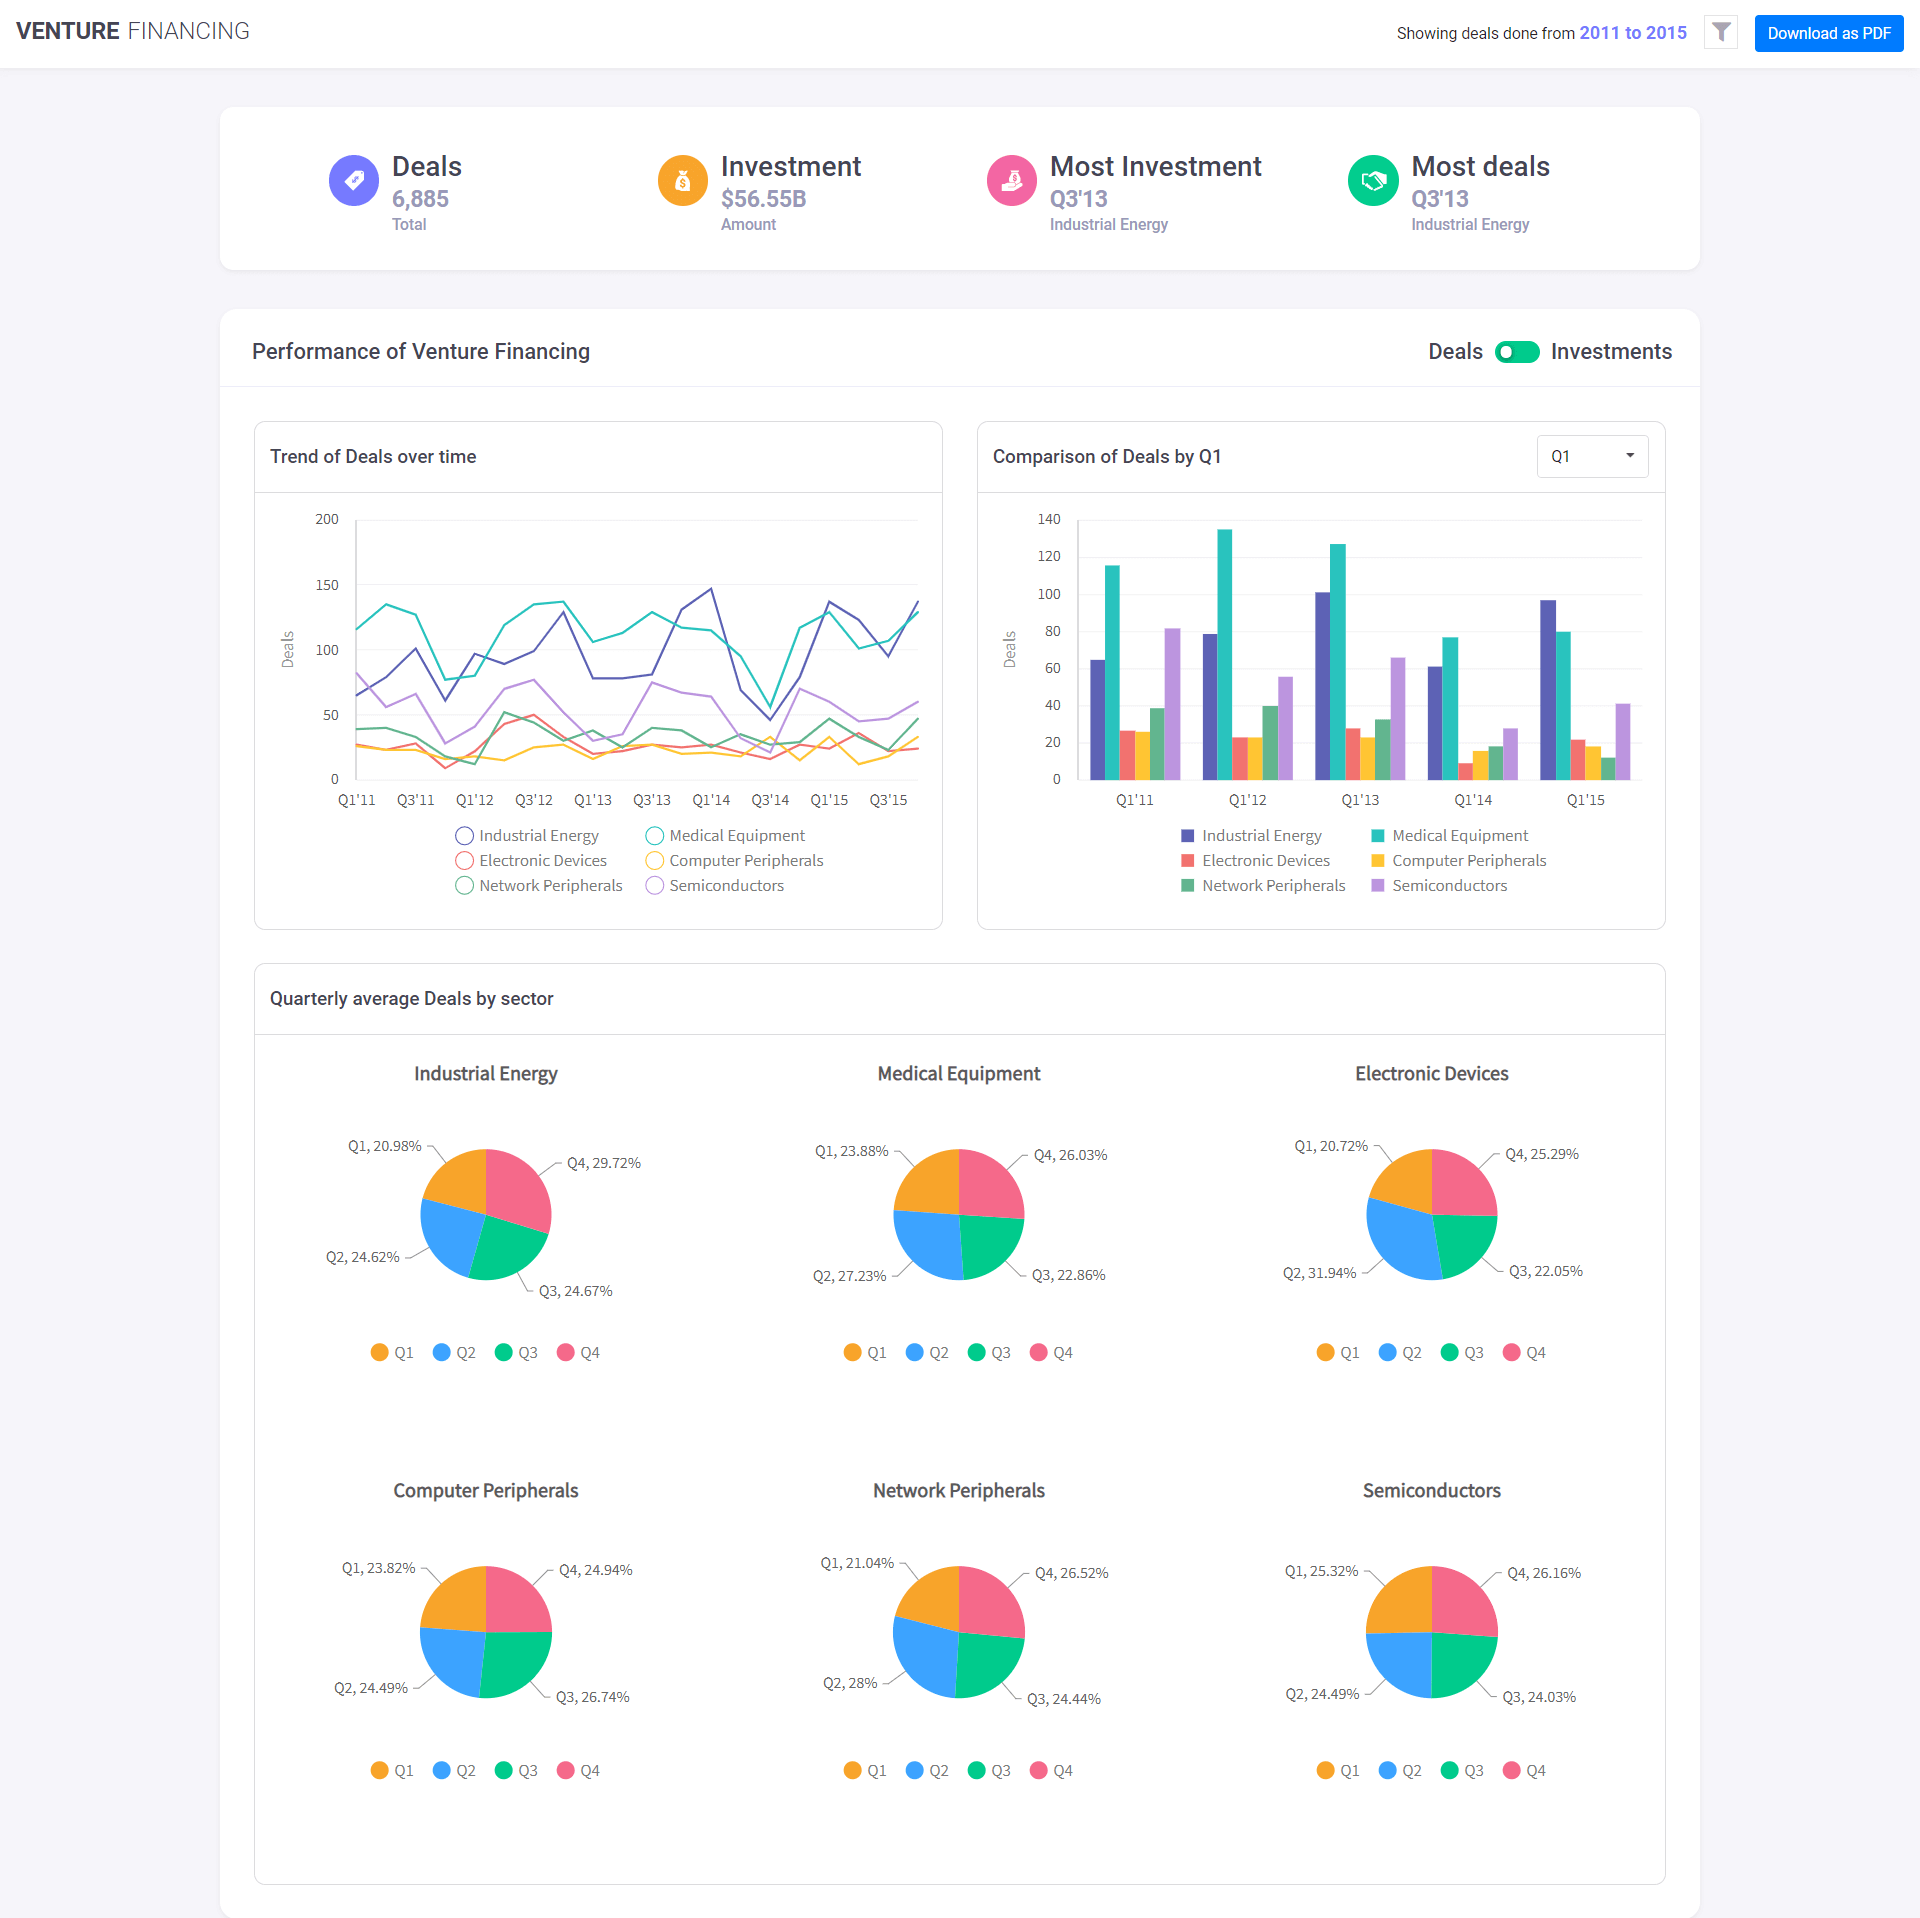
You can create this dashboard by simply following these steps:
1. You have to create components for the Venture financing dashboard. Go to src > components folder. Create the new Base.js file. Add the lines from the sample code.
2. Create card.js file and insert the lines from the sample.
3. Next, create FusionExport.js file and insert the lines from the sample.
4. Now, you have to create the container for Key Performance Indicator (KPI). Create the kpi-container.js file. Then add the lines from the sample.
Source Code
You can get the source code from here.
Once the download is done, unzip the file. Then navigate through venture-financing-dashboard > src folder. Here, you will find the source code of the venture financing dashboard.
How Can I Build Beautiful Investment Dashboards with JavaScript?
Now, you have learned to build beautiful dashboards with JavaScript. Keep visiting our website to get more tutorials on building interactive web applications.
Head over and check out the full FusionCharts suite and all of the examples to get started!