Real-time charting is becoming a mainstay in many developers’ toolbelts in today’s fast-paced world of high stock market returns and 24/7 cryptocurrency updates. Real-time charts can be difficult to implement, but with the right charting library, they can be simple.
FusionCharts is a simple charting library that allows for real-time charting with just a few commands. FusionCharts supports a variety of languages and frameworks.
In this post, we’ll focus primarily on Javascript and how FusionCharts provides a comprehensive set of time-based live charts for the stock market and cryptocurrency historical data, in addition to real-time charting.
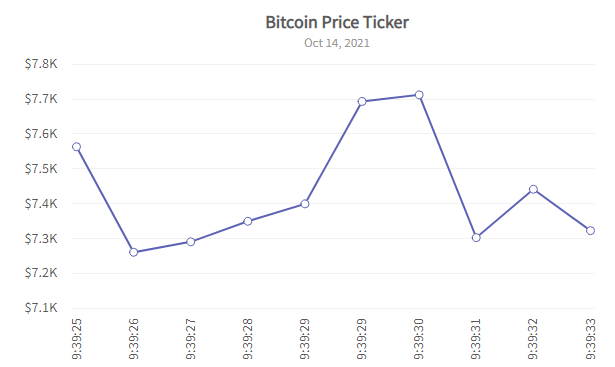
So, let’s take a look at the various Javascript commands for deploying real-time charts. We’ll also walk you through the entire source code for making a real-time chart with FusionCharts. The example demonstrates how to make a sample chart called “Bitcoin Price Ticker.”
Table of Contents
How can I build a real-time Bitcoin ticker chart?
To create a real-time chart follow these steps:
- In the JSON data, set the attributes and their corresponding values in
"<attributeName>": "<value>"format. Here are a few sample records you can use to initialize the chart.dataset: [ { data: [ { value: "7358" }, { value: "7361" }, { value: "7362" } ] } ] - Specify the chart type using the
typeattribute. To render a real-time line chart, setrealtimeline. - Set the container object using
renderAtattribute. You will see in this sample that the renderAt object is named “chart-container” and we define it in the HTML section of the sample below. - Specify the dimension of the chart using
widthandheightattributes. - Set the type of data (JSON/XML) you want to pass to the chart object using
dataFormatattribute.
For a detailed list of attributes, refer to the chart attributes page of the real-time line chart.
How can I build a real-time Bitcoin ticket with Javascript?
Javascript:
FusionCharts.ready(function() {
   var d = new Date();
   var monthArr = [
      "Jan",
      "Feb",
      "Mar",
      "Apr",
      "May",
      "June",
      "Jul",
      "Aug",
      "Sep",
      "Oct",
      "Nov",
      "Dec"
   ];

   var outDate =
      monthArr[d.getMonth()] + " " + d.getDate() + ", " + d.getFullYear();

   new FusionCharts({
      type: "realtimeline",

      renderAt: "chart-container",
      width: "600",
      height: "400",
      dataFormat: "json",
      dataSource: {
         chart: {
            caption: "Bitcoin Price Ticker",
            subCaption: outDate,
            numberPrefix: "$",
            numdisplaysets: "10",
            labeldisplay: "rotate",
            showRealTimeValue: "0",
            theme: "fusion",
            plotToolText: "$label<br>Price: <b>$dataValue</b>",
            setAdaptiveYMin: "1"
         },
         categories: [
            {
               category: [
                  {
                     label:
                        d.getHours() +
                        ":" +
                        d.getMinutes() +
                        ":" +
                        (d.getSeconds() - 2)
                  },
                  {
                     label:
                        d.getHours() +
                        ":" +
                        d.getMinutes() +
                        ":" +
                        (d.getSeconds() - 1)
                  },
                  {
                     label:
                        d.getHours() +
                        ":" +
                        d.getMinutes() +
                        ":" +
                        d.getSeconds()
                  }
               ]
            }
         ],
         dataset: [
            {
               data: [
                  {
                     value: "7358"
                  },
                  {
                     value: "7361"
                  },
                  {
                     value: "7362"
                  }
               ]
            }
         ]
      },
      events: {
         initialized: function(evt, arg) {
            // Get reference to the chart
            var chartRef = evt.sender;

            function updateData() {
               var t = new Date(),
                  date =
                     t.getHours() + ":" + t.getMinutes() + ":" + t.getSeconds(),
                  val = Math.floor(Math.random() * (7800 - 7200 + 1)) + 7200,
                  strData = "&label=" + date + "&value=" + val;

               // Feed it to chart.
               chartRef.feedData(strData);
            }

            chartRef.intervalUpdateId = setInterval(updateData, 1000);
         },

         disposed: function(evt, args) {
            clearInterval(evt.sender.intervalUpdateId);
         }
      }
   }).render();
});
HTML:
<div id="chart-container"></div>How can I build a real-time Bitcoin ticket with real data?
Our example in this article just uses some random data to send to the real-time chart to demonstrate the capability. However, if you want to hook up real Bitcoin data to FusionCharts you can get Bitcoin (and other cryptocurrency) data from coinlayer.com. Coinlayer offers an easy-to-use API for accessing real-time and historical cryptocurrency prices from Bitcoin, Ethereum, Dogecoin, and hundreds of other cryptocurrencies. Coinlayer has a full range of documentation for both live and historical cryptocurrency data.
Sample REST API call URL for live cryptocurrency data:
https://api.coinlayer.com/live?access_key=YOUR_ACCESS_KEYSample REST API response:
{
"success": true,
"terms": "https://coinlayer.com/terms",
"privacy": "https://coinlayer.com/privacy",
"timestamp": 1529571067,
"target": "USD",
"rates": {
"611": 0.389165,
"ABC": 59.99,
"ACP": 0.014931,
"ACT": 0.15927,
"ACT*": 0.14371,
"ADA": 0.160502,
"ADCN": 0.001406,
"ADL": 121.5,
"ADX": 0.427854,
"ADZ": 0.02908,
"AE": 2.551479,
"AGI": 0.12555,
"AIB": 0.005626,
"AIDOC": 0.02605,
[...]
}
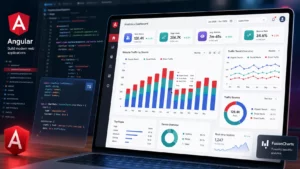
}How can I get started building visually stunning real-time charts with FusionCharts?
FusionCharts is used by thousands of developers and offers real-time chart integrations with many frontend and backend frameworks. FusionCharts also offers FusionTime which is a powerful time-series and stock chart that can render thousands of data points in modern browsers. It is easy to get started with FusionCharts by downloading the library for your frontend or backend. We support 10+ frameworks and languages of your choice including JavaScript, Angular, React, jQuery, Vue.js, Ember, React Native, AngularJS, Svelte, ASP.NET, PHP, Java, Ruby on Rails, and Django.