Financial dashboards are a must-have tool for all businesses and organizations. This is because they allow company managers and decision-makers to track and monitor key indicators and metrics. These, in turn, provide key insights into a company’s progress. This helps them make informed and educated decisions about the future.
If you are looking to develop a financial dashboard for your organization, then here is the perfect guide for you. We’ll show you how to develop awesome dashboards using FusionCharts in 6 easy to follow steps. With FusionCharts, you don’t need much coding experience to develop a dashboard for your use case. FusionCharts provides default functionality that is normally sufficient to meet your needs.
Now let’s take a look at the financial dashboard we’ll develop.
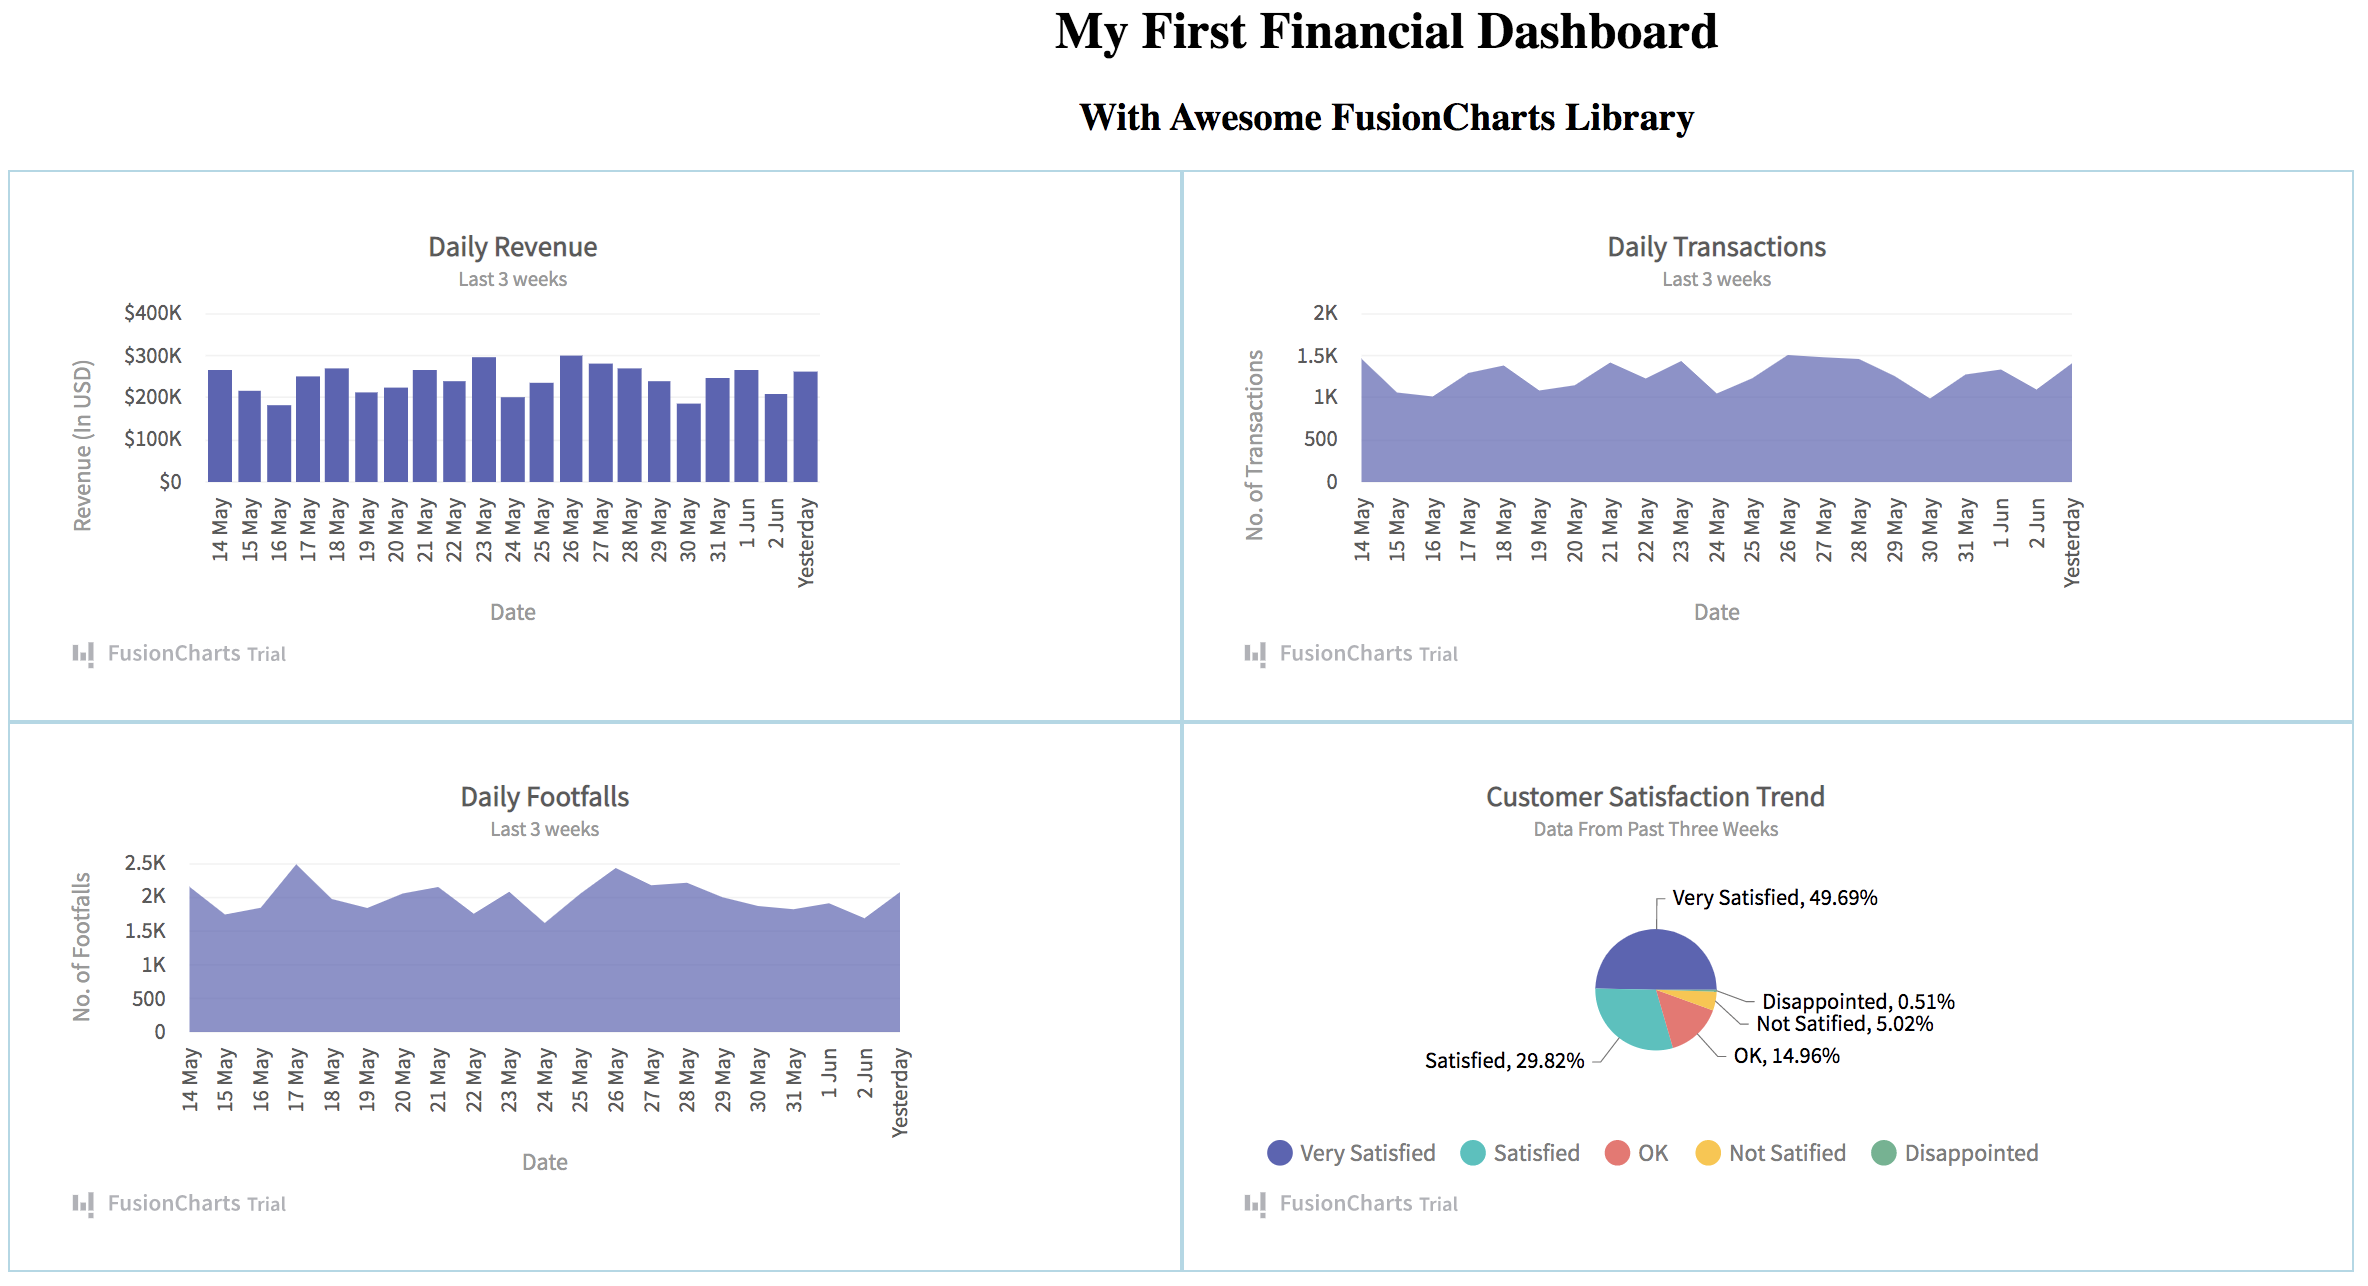
Table of Contents
Step 1: What Financial Dashboard Components and Layout Should You Use?
The first step is to decide which charts and graphs you want on your dashboard. In our example, we have four charts:
- Sales revenue (daily) using a column 2D chart
- Transaction data (daily) using an area chart
- Footfalls data (daily) using an area graph
- Summary of customer satisfaction scores using a 2D pie chart
We have chosen a simple layout for our dashboard with two charts per column. Create two empty files:
dashboard.htmlfor HTML codedashboard.jsfor Javascript
Then, open the dashboard.html file and paste the following in the header section:
<style>
.chart-container {
    width: 40%;
    float:  left;
    padding: 20px;
    border: 2px solid lightblue;
}
</style>
Step 2: How do I Include FusionCharts Libraries?
After that, we need to include the FusionCharts core library and the Fusion theme library. To do this, include the following anywhere in the header of the HTML file.
<!-- Include fusioncharts core library -->
<script type="text/javascript" src="https://cdn.fusioncharts.com/fusioncharts/latest/fusioncharts.js"></script>
<!-- Include fusion theme -->
<script type="text/javascript" src="https://cdn.fusioncharts.com/fusioncharts/latest/themes/fusioncharts.theme.fusion.js"></script>
Step 3: How do I Create Containers for Financial Dashboard Components?
Next, let’s define containers for each chart using the div tag in HTML. Add the following anywhere in the body of the dashboard.html file:
<!-- Add all the containers -->
<div class="chart-container" id="sales-chart-container">FusionCharts XT will load here!</div>
<div class="chart-container" id="trans-chart-container">FusionCharts XT will load here!</div>
<div class="chart-container" id="footfall-chart-container">FusionCharts XT will load here!</div>
<div class="chart-container" id="cs-chart-container">FusionCharts XT will load here!</div>
Step 4: How to Create the Data Sources for Financial Dashboard?
Now, because all four charts show four different parameters, we need four different data sources. Open the dashboard.js file and paste the following four data sources as JSON objects:
const salesRevData = [
  {
    label: "14 May",
    value: "267111"
  },
  {
    label: "15 May",
    value: "217207"
  },
  {
    label: "16 May",
    value: "185836"
  },
  {
    label: "17 May",
    value: "251074"
  },
  {
    label: "18 May",
    value: "273374"
  },
  {
    label: "19 May",
    value: "215724"
  },
  {
    label: "20 May",
    value: "227219"
  },
  {
    label: "21 May",
    value: "268160"
  },
  {
    label: "22 May",
    value: "239446"
  },
  {
    label: "23 May",
    value: "297084"
  },
  {
    label: "24 May",
    value: "204399"
  },
  {
    label: "25 May",
    value: "236195"
  },
  {
    label: "26 May",
    value: "302120"
  },
  {
    label: "27 May",
    value: "282909"
  },
  {
    label: "28 May",
    value: "272096"
  },
  {
    label: "29 May",
    value: "241639"
  },
  {
    label: "30 May",
    value: "189526"
  },
  {
    label: "31 May",
    value: "248034"
  },
  {
    label: "1 Jun",
    value: "266247"
  },
  {
    label: "2 Jun",
    value: "212719"
  },
  {
    label: "Yesterday",
    value: "264416"
  }
];

const dailyTransData = [
  {
    label: "14 May",
    value: "1464"
  },
  {
    label: "15 May",
    value: "1062"
  },
  {
    label: "16 May",
    value: "1014"
  },
  {
    label: "17 May",
    value: "1294"
  },
  {
    label: "18 May",
    value: "1382"
  },
  {
    label: "19 May",
    value: "1085"
  },
  {
    label: "20 May",
    value: "1150"
  },
  {
    label: "21 May",
    value: "1420"
  },
  {
    label: "22 May",
    value: "1228"
  },
  {
    label: "23 May",
    value: "1435"
  },
  {
    label: "24 May",
    value: "1051"
  },
  {
    label: "25 May",
    value: "1231"
  },
  {
    label: "26 May",
    value: "1509"
  },
  {
    label: "27 May",
    value: "1480"
  },
  {
    label: "28 May",
    value: "1461"
  },
  {
    label: "29 May",
    value: "1258"
  },
  {
    label: "30 May",
    value: "991"
  },
  {
    label: "31 May",
    value: "1275"
  },
  {
    label: "1 Jun",
    value: "1336"
  },
  {
    label: "2 Jun",
    value: "1097"
  },
  {
    label: "Yesterday",
    value: "1411"
  }
];

const dailyFootfallData = [
    {
      label: "14 May",
      value: "2154"
    },
    {
      label: "15 May",
      value: "1742"
    },
    {
      label: "16 May",
      value: "1845"
    },
    {
      label: "17 May",
      value: "2490"
    },
    {
      label: "18 May",
      value: "1975"
    },
    {
      label: "19 May",
      value: "1840"
    },
    {
      label: "20 May",
      value: "2054"
    },
    {
      label: "21 May",
      value: "2153"
    },
    {
      label: "22 May",
      value: "1755"
    },
    {
      label: "23 May",
      value: "2080"
    },
    {
      label: "24 May",
      value: "1617"
    },
    {
      label: "25 May",
      value: "2053"
    },
    {
      label: "26 May",
      value: "2435"
    },
    {
      label: "27 May",
      value: "2177"
    },
    {
      label: "28 May",
      value: "2214"
    },
    {
      label: "29 May",
      value: "1998"
    },
    {
      label: "30 May",
      value: "1871"
    },
    {
      label: "31 May",
      value: "1822"
    },
    {
      label: "1 Jun",
      value: "1909"
    },
    {
      label: "2 Jun",
      value: "1689"
    },
    {
      label: "Yesterday",
      value: "2076"
    }
  ];

const CSData = [
  {
    label: "Very Satisfied",
    value: "10000"
  },
  {
    label: "Satisfied",
    value: "6001"
  },
  {
    label: "OK",
    value: "3011"
  },
  {
    label: "Not Satified",
    value: "1011"
  },
  {
    label: "Disappointed",
    value: "102"
  },

];
Step 5: How to Specify the Chart Configurations for Financial Dashboard?
Once you are done with that, specify each chart. To do this, create a new FusionChart object by passing the chart configuration as a parameter to its constructor. A chart configuration is also a JSON object. Paste the following at the end of the dashboard.js file:
var salesRevChart = new FusionCharts({
  type: "column2d",
  renderAt: "sales-chart-container",
  width: "500",
  height: "300",
  dataFormat: "json",
  dataSource: {
    chart: {
      caption: "Daily Revenue",
      subcaption: "Last 3 weeks",
      xaxisname: "Date",
      yaxisname: "Revenue (In USD)",
      numberprefix: "$",
      showvalues: "0",
      theme: "fusion"
    },
    data: salesRevData
  }
});

var dailyTransChart = new FusionCharts({
  type: "area2d",
  renderAt: "trans-chart-container",
  width: "550",
  height: "300",
  dataFormat: "json",
  dataSource: {
    chart: {
      caption: "Daily Transactions",
      subcaption: "Last 3 weeks",
      xaxisname: "Date",
      yaxisname: "No. of Transactions",
      showvalues: "0",
      theme: "fusion"
    },
    data: dailyTransData
  }
});

var dailyFootfallChart = new FusionCharts({
  type: "area2d",
  renderAt: "footfall-chart-container",
  width: "550",
  height: "300",
  dataFormat: "json",
  dataSource: {
    chart: {
      caption: "Daily Footfalls",
      subcaption: "Last 3 weeks",
      xaxisname: "Date",
      yaxisname: "No. of Footfalls",
      showvalues: "0",
      theme: "fusion"
    },
    data: dailyFootfallData
  }
});

var dailyCSatChart = new FusionCharts({
  type: "pie2d",
  renderAt: "cs-chart-container",
  width: "550",
  height: "300",
  dataFormat: "json",
  dataSource: {
    chart: {
      caption: "Customer Satisfaction Trend",
      subcaption: "Data From Past Three Weeks",
      showvalues: "1",
      theme: "fusion"
    },
    data: CSData
  }
});
Step 6: How to Render the Charts in Financial Dashboard?
After that, call the ready() function from the FusionCharts library and render each chart. The ready()method takes a function as an argument that returns a FusionCharts object. Paste the following at the end of the dashboard.js file:
FusionCharts.ready(function(){
  salesRevChart.render()
});

FusionCharts.ready(function(){
  dailyTransChart.render()
});

FusionCharts.ready(function(){
  dailyFootfallChart.render()
});

FusionCharts.ready(function(){
  dailyCSatChart.render()
});
That’s it! We are done. We just created an awesome financial dashboard in a matter of minutes using 6 easy to follow and simple steps. Download the complete dashboard.html and dashboard.js files and try out this code. To view your financial dashboard open the dashboard.html file in your web browser.
Where Can I Find More Samples of FusionCharts Financial Dashboards?
Our team of experts has developed many business dashboards using FusionCharts. Browse through our complete list of beautiful dashboards built using FusionCharts for web and mobile. All dashboards have their source code freely available. You can download the source code for the dashboard that best matches your particular use case and customize it for your particular application. With stunning data presentations, beautiful interfaces, easy-to-use APIs, efficient data loading, and much more, FusionCharts offers the best out-of-the-box data visualization solution for your desktop, laptop, and mobile devices.
Don’t miss out on the awesome FusionCharts features. Download FusionCharts and make the most of your data.
