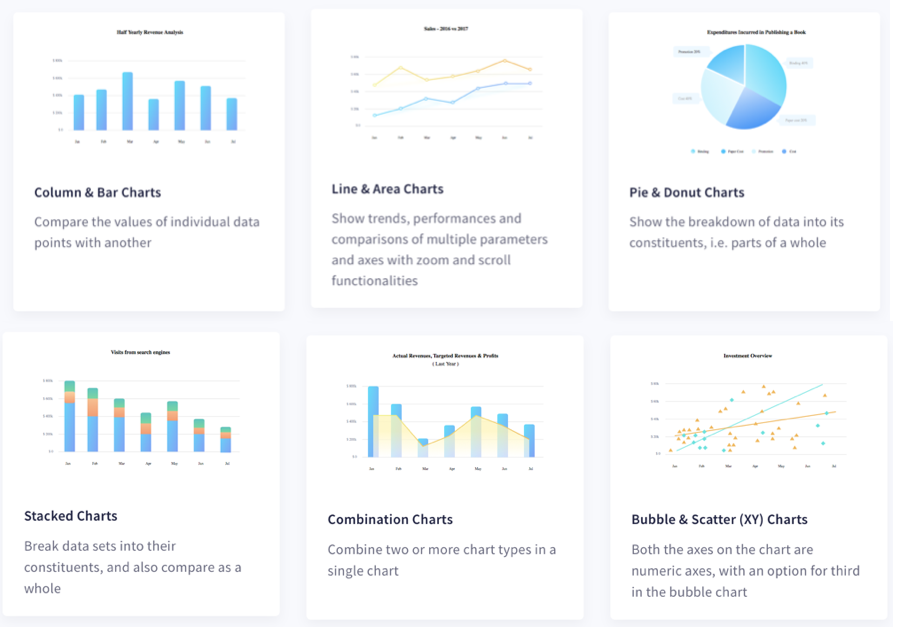
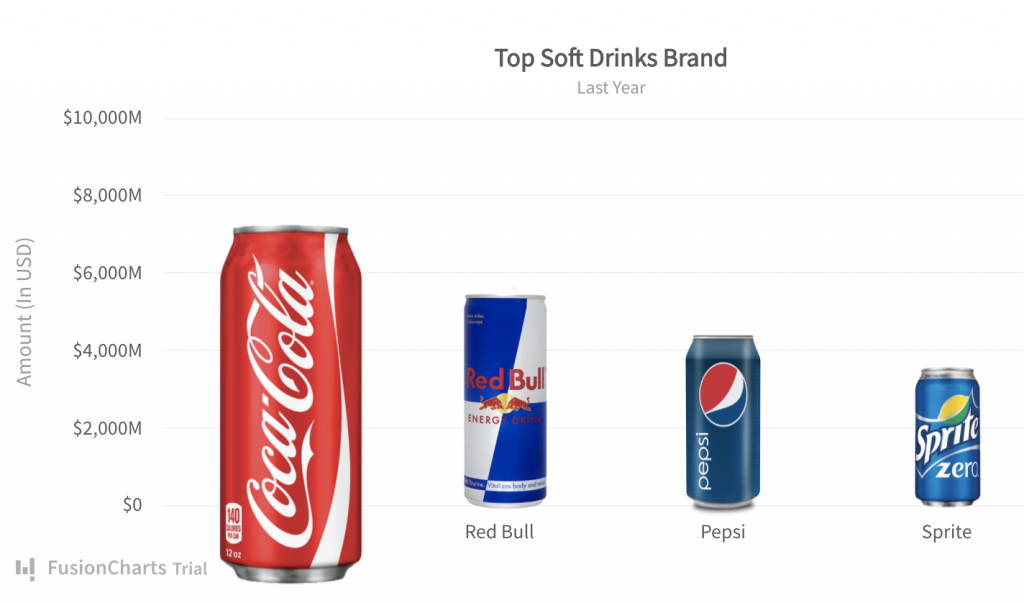
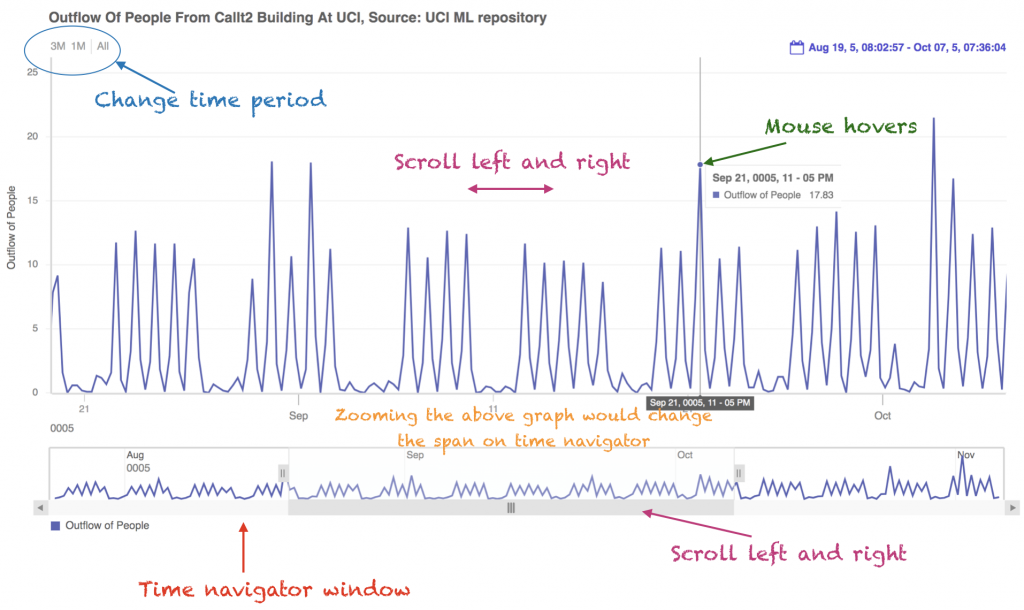
FusionCharts Suite XT comes with 90+ charts that can be used to visualize data for a number of business applications. Additionally, it also includes several basic and advanced features using which charts can be configured for improved visualization.One such feature is the capability to implement the drill-down interactivity in charts. With the drill-down interactivity, data plots in a chart can be configured to act as hotspots; clicking a data plot redirects the user to an external link or another chart. Drill-down charts can be implemented using simple links (data plots will be linked to simple URLs that will open in the same page or in a different page or to JavaScript functions defined in the same page) and charts links (data plots will be linked to other charts that will render information at several levels of detail).All charts (except for the zoom-line chart) in FusionCharts Suite XT can be configured to be rendered as drill-down charts.Click here to know more about the drill-down charts supported by FusionCharts.Another important feature is the capability to create charts by fetching data from a database.This tutorial combines these features of FusionCharts with a .asmx based web-service to render a multi-series drill-down chart by fetching data from a database, using FusionCharts’ JSON structure, in a ASP.NET-based web application.A web Service is a web-based functionality that can be accessed through web-based protocols and used by web applications.

Requirements

We need the following applications installed before rendering FusionCharts in VB.Net and Windows-based applications:

Implementing FusionCharts with the .NET Web Service(.asmx)

We would now describe step by step work through how FusionCharts supported drill-down functionality by which a Multi-series chart could be rendered in a ASP.NET based web application acquiring FusionCharts prescribed JSON structure through .asmx based web service which is fetching data from database.The entire process is divided in three sub processes, as mentioned below.
  • Creating a database for storing the chart values series wise which could be fetched through web service and prepare the FusionCharts prescribed JSON structure for rendering the chart.
  • Creating the Web Service(.asmx) for fetching data from database and creating FusionCharts prescribed JSON structure.
  • Creating a ASP.NET web page for consuming the created Web Service and rendering FusionCharts.

I. Creating a database for storing series wise values for chart

Creating a New Project

The step by step process for creating a new project is given below.

Step 1

Open Visual Studio and click File → New → Project, as shown in the image below.The New Project dialog box opens.

Step 2

In the New Project dialog box, select Installed Templates → Visual C# → Web → ASP.Net Web Application (.NET Framework), as shown in the image below.

Step 3

In the Name field (in the New Project dialog box), type Demo FusionCharts Web Service to name the project as shown below.A project structure, as shown in the image below, is created.

Creating a Database and Including it in the App_Data ASP.NET Folder

Step 1

Create a database, Product and create two tables named quarterwiseProductData and Series_wise_Product. Use the table structure shown in the image below.

Step 2

Add the App_Data ASP.NET folder within the Demo FusionCharts Web Service project as shown in the image below.

Step 3

Save the Product database within the App_Data folder.

II. Creating the Web Service(.asmx)

A .asmx file is used with ASP.NET to move data and perform other actions behind the scenes. .asmx file is also used as a service which does not have a GUI (graphical user interface).The steps below outline the process for creating a .asmx file based on the Product database created above.

Step 1

Right click -> [Project Name] -> Add -> New Item as shown below.

Step 2

Click Add → New Item. The Add New Item dialog box opens. Choose Web Service (ASMX) among the options as shown below.

Step 3

Give a name to the project, (GenerateData in our case) inside the Name text box.

Step 4

Add the code given below to the GenerateData.asmx.cs file.
using System;
using System.Collections.Generic;
using System.Linq;
using System.Web;
using System.Web.Services;
using System.Data.SqlClient;
using System.Data;
using System.Configuration;
using System.Text;


namespace Demo_FusionCharts_Web_service {
    /// 
    /// Summary description for GenrateData
    /// 
    [WebService(Namespace = "http://tempuri.org/")]
    [WebServiceBinding(ConformsTo = WsiProfiles.BasicProfile1_1)]
    [System.ComponentModel.ToolboxItem(false)]
    // To allow this Web Service to be called from script, using ASP.NET AJAX, uncomment the following line. 
    // [System.Web.Script.Services.ScriptService]
    public class GenrateData: System.Web.Services.WebService {
        List < quarterwiseProductData > qdata = new List < quarterwiseProductData > ();
        List < Series_wise_Product > sdata = new List < Series_wise_Product > ();

        [WebMethod]
        public string getData() {
            List < string > ProductMonth = new List < string > ();
            List < string > ProductQuarter = new List < string > ();
            List < int > ProductValue = new List < int > ();
            List < string > ProductSeries = new List < string > ();
            List < string > SeriesNames = new List < string > ();
            List < string > LinkValue = new List < string > ();
            List < int > SeriesValue = new List < int > ();


            string constr = ConfigurationManager.ConnectionStrings["constr"].ConnectionString;
            SqlConnection con = new SqlConnection();
            con.ConnectionString = constr;
            con.Open();
            SqlCommand com = new SqlCommand("select * from quarterwiseProductData", con);
            SqlDataReader sda = com.ExecuteReader();
            while (sda.Read()) {

                quarterwiseProductData qpd = new quarterwiseProductData();
                qpd.quarter = sda[0].ToString();
                qpd.series = sda[1].ToString();
                qpd.Month = sda[2].ToString();
                qpd.Value = Int32.Parse(sda[3].ToString());
                qdata.Add(qpd);
            }
            foreach(quarterwiseProductData q in qdata) {
                ProductMonth.Add(q.Month);
                ProductQuarter.Add(q.quarter);
                ProductValue.Add(q.Value);
                ProductSeries.Add(q.series);

            }
            SqlCommand com1 = new SqlCommand("select * from Series_wise_Product", con);
            SqlDataReader sda1 = com1.ExecuteReader();
            while (sda1.Read()) {
                Series_wise_Product swp = new Series_wise_Product();
                swp.seriesName = sda1[0].ToString();
                swp.SeriesValue = Int32.Parse(sda1[1].ToString());
                swp.link = sda1[2].ToString();
                sdata.Add(swp);
            }
            foreach(Series_wise_Product ss in sdata) {
                SeriesNames.Add(ss.seriesName);
                LinkValue.Add(ss.link);
                SeriesValue.Add(ss.SeriesValue);
            }
            //Building JSON String
            StringBuilder JSON = new StringBuilder();
            //appending all cosmatic properties
            JSON.Append("{" +
                "'chart': {" +
                "'caption': 'Best-Selling Vehicle Manufacturers in Japan in 2016'," +
                "'exportEnabled':'1'," +
                "'xAxisname': 'Quarter'," +
                "'yAxisName': 'Number of vehicle sold'," +

                "'plotFillAlpha': '80'," +
                "'theme': 'zune'," +
                "'baseFontColor': '#333333'," +
                "'baseFont': 'Helvetica Neue,Arial'," +
                "'captionFontSize': '14'," +
                "'subcaptionFontSize': '14'," +
                "'subcaptionFontBold': '0'," +
                "'showBorder': '0'," +
                "'bgColor': '#ffffff'," +
                "'showShadow': '0'," +
                "'canvasBgColor': '#ffffff'," +
                "'canvasBorderAlpha': '0'," +
                "'divlineAlpha': '100'," +
                "'divlineColor': '#999999'," +
                "'divlineThickness': '1'," +
                "'divLineIsDashed': '1'," +
                "'divLineDashLen': '1'," +
                "'divLineGapLen': '1'," +
                "'usePlotGradientColor':'0'," +
                "'showplotborder': '0'," +
                "'valueFontColor': '#ffffff'," +
                "'placeValuesInside': '1'," +
                "'showHoverEffect': '1'," +
                "'rotateValues': '1'," +
                "'showXAxisLine': '1'," +
                "'xAxisLineThickness': '1'," +
                "'xAxisLineColor': '#999999'," +
                "'showAlternateHGridColor': '0'," +
                "'legendBgAlpha': '0'," +
                "'legendBorderAlpha': '0'," +
                "'legendShadow': '0'," +
                "'legendItemFontSize': '10'," +
                "'legendItemFontColor': '#666666'" +
                " },"
            );
            //appenfing into StringBuilder objectiterating through collections
            JSON.Append("'categories': [{" +

                "'category': [ ");
            foreach(var quar in ProductQuarter.Distinct()) {
                //for last element escaping comma
                if (quar == ProductQuarter.Distinct().Last()) {
                    JSON.Append("{ 'label': '" + quar + "' }");
                    break;

                }
                JSON.Append("{ 'label': '" + quar + "' },");

            }
            JSON.Append("]" +
                "}]," +
                "'dataset': [");
            foreach(var prod in SeriesNames.Distinct()) {
                List < Series > seriesWiseValue = getSeriesWiseData(prod);
                JSON.Append("{" +
                    "'seriesname':" + "'" + prod + "'," + "'data': [");
                foreach(var linkValue in seriesWiseValue) {
                    if (linkValue == seriesWiseValue.Last()) {
                        JSON.Append("{" +

                            "'value':" + "'" + linkValue.value + "','link':" + "'" + linkValue.link + "'}");
                        break;
                    }

                    JSON.Append("{" +

                        "'value':" + "'" + linkValue.value + "','link':" + "'" + linkValue.link + "'},");
                }
                if (prod == SeriesNames.Distinct().Last()) {
                    JSON.Append("]" +

                        " }");
                    break;
                }
                JSON.Append("]" +

                    " },");

            }
            JSON.Append("],");
            JSON.Append("'linkeddata': [");
            foreach(var quat in ProductQuarter.Distinct()) {
                if (quat == ProductQuarter.Distinct().Last()) {
                    JSON.Append("{'id': '" + quat + "'," +

                        "'linkedchart': {" +
                        "'chart': {" +

                        "'subCaption': 'FusionCharts'," +
                        "'exportEnabled':'1'," +
                        "'xAxisname': 'Months'," +
                        "'yAxisName': 'Revenues (In USD)'," +
                        "'numberPrefix': '$'," +
                        "'plotFillAlpha': '80'," +
                        "'theme': 'zune'," +
                        "'baseFontColor': '#333333'," +
                        "'baseFont': 'Helvetica Neue,Arial'," +
                        "'captionFontSize': '14'," +
                        "'subcaptionFontSize': '14'," +
                        "'subcaptionFontBold': '0'," +
                        "'showBorder': '0'," +
                        "'bgColor': '#ffffff'," +
                        "'showShadow': '0'," +
                        "'canvasBgColor': '#ffffff'," +
                        "'canvasBorderAlpha': '0'," +
                        "'divlineAlpha': '100'," +
                        "'divlineColor': '#999999'," +
                        "'divlineThickness': '1'," +
                        "'divLineIsDashed': '1'," +
                        "'divLineDashLen': '1'," +
                        "'divLineGapLen': '1'," +
                        "'usePlotGradientColor':'0'," +
                        "'showplotborder': '0'," +
                        "'valueFontColor': '#ffffff'," +
                        "'placeValuesInside': '1'," +
                        "'showHoverEffect': '1'," +
                        "'rotateValues': '1'," +
                        "'showXAxisLine': '1'," +
                        "'xAxisLineThickness': '1'," +
                        "'xAxisLineColor': '#999999'," +
                        "'showAlternateHGridColor': '0'," +
                        "'legendBgAlpha': '0'," +
                        "'legendBorderAlpha': '0'," +
                        "'legendShadow': '0'," +
                        "'legendItemFontSize': '10'," +
                        "'toolBarHAlign':'left'," +
                        "'legendItemFontColor': '#666666'" +


                        " }," +
                        "'categories': [{" +
                        "'category': [" +

                        getQuarterWiseMonth(quat) +
                        "]" +
                        "}],"


                    );
                    JSON.Append("'dataset': [");

                    foreach(var seri in SeriesNames.Distinct()) {
                        if (seri == SeriesNames.Distinct().Last()) {
                            JSON.Append("{" +
                                "'seriesname': '" + seri + "'," +
                                "'data': [" + getquarterseriesWiseData(seri, quat) + "]}"
                            );
                            break;
                        }
                        JSON.Append("{" +
                            "'seriesname': '" + seri + "'," +
                            "'data': [" + getquarterseriesWiseData(seri, quat) + "]},"
                        );
                    }
                    JSON.Append("]}}");
                    break;
                }

                JSON.Append("{'id': '" + quat + "'," +

                    "'linkedchart': {" +
                    "'chart': {" +
                    "'subCaption': 'FusionCharts'," +
                    "'exportEnabled':'1'," +
                    "'xAxisname': 'Months'," +
                    "'yAxisName': 'Revenues (In USD)'," +
                    "'numberPrefix': '$'," +
                    "'plotFillAlpha': '80'," +
                    "'theme': 'zune'," +
                    "'baseFontColor': '#333333'," +
                    "'baseFont': 'Helvetica Neue,Arial'," +
                    "'captionFontSize': '14'," +
                    "'subcaptionFontSize': '14'," +
                    "'subcaptionFontBold': '0'," +
                    "'showBorder': '0'," +
                    "'bgColor': '#ffffff'," +
                    "'showShadow': '0'," +
                    "'canvasBgColor': '#ffffff'," +
                    "'canvasBorderAlpha': '0'," +
                    "'divlineAlpha': '100'," +
                    "'divlineColor': '#999999'," +
                    "'divlineThickness': '1'," +
                    "'divLineIsDashed': '1'," +
                    "'divLineDashLen': '1'," +
                    "'divLineGapLen': '1'," +
                    "'usePlotGradientColor':'0'," +
                    "'showplotborder': '0'," +
                    "'valueFontColor': '#ffffff'," +
                    "'placeValuesInside': '1'," +
                    "'showHoverEffect': '1'," +
                    "'rotateValues': '1'," +
                    "'showXAxisLine': '1'," +
                    "'xAxisLineThickness': '1'," +
                    "'xAxisLineColor': '#999999'," +
                    "'showAlternateHGridColor': '0'," +
                    "'legendBgAlpha': '0'," +
                    "'legendBorderAlpha': '0'," +
                    "'legendShadow': '0'," +
                    "'legendItemFontSize': '10'," +
                    "'legendItemFontColor': '#666666'," +
                    "'toolBarHAlign':'left'" +
                    " }," +
                    "'categories': [{" +
                    "'category': [" +

                    getQuarterWiseMonth(quat) +
                    "]" +
                    "}],"
                );
                JSON.Append("'dataset': [");

                foreach(var seri in SeriesNames.Distinct()) {

                    if (seri == SeriesNames.Distinct().Last()) {
                        JSON.Append("{" +
                            "'seriesname': '" + seri + "'" +
                            ",'data': [" + getquarterseriesWiseData(seri, quat) + "]}"

                        );

                        break;

                    }
                    JSON.Append("{" +
                        "'seriesname': '" + seri + "'," +
                        "'data': [" + getquarterseriesWiseData(seri, quat) + "]},"
                    );
                }
                JSON.Append("]}},");
            }

            JSON.Append("]}");
            //replacing all ' into "
            string str = JSON.ToString().Replace('\'', '\"');
            return str;
        }

        public List < string > quarterWiseMonth(string quarter) {

            var monthVal = from product in qdata
            where product.quarter == quarter
            orderby product.Month descending
            select product.Month;
            return monthVal.ToList();

        }
        public List < Series > getSeriesWiseData(string series) {
            List < Series > valueLink = new List < Series > ();

            var seriesLink = from product in sdata
            where product.seriesName == series
            select new {
                linkdata = product.link, valuedata = product.SeriesValue
            };

            foreach(var obj in seriesLink) {
                valueLink.Add(new Series(obj.valuedata, obj.linkdata));
            }

            return valueLink;
        }
        public List < int > getMonthwiseValue(string series, string quarter) {

            var monthValue = from product in qdata

            where product.quarter == quarter & product.series == series
            select product.Value;
            return monthValue.ToList();
        }
        //function for fetching series wise and quarter wise values
        public StringBuilder getquarterseriesWiseData(string series, string quarter) {

            StringBuilder subjson = new StringBuilder();

            foreach(var seriwise in getMonthwiseValue(series, quarter)) {
                if (seriwise == getMonthwiseValue(series, quarter).Last()) {
                    subjson.Append("{" +
                        "'value': '" + seriwise + "'}");
                    break;
                }
                subjson.Append("{" +
                    "'value': '" + seriwise + "'},");
            }
            return subjson;
        }
        //For fetching quarter wise data.
        public StringBuilder getQuarterWiseMonth(string quarter) {

            StringBuilder subjson = new StringBuilder();
            foreach(var month in quarterWiseMonth(quarter).Distinct()) {
                if (month == quarterWiseMonth(quarter).Distinct().Last()) {
                    subjson.Append("{" +
                        "'label': '" + month + "'}");
                    break;
                }
                subjson.Append("{" +
                    "'label': '" + month + "'},");
            }
            return subjson;
        }
    }
    public class Series {
        public int value;
        public string link;
        public Series(int value, string link) {
            this.value = value;
            this.link = link;
        }
    }
    public class quarterwiseProductData {
        public string quarter {
            get;
            set;
        }
        public string series {
            get;
            set;
        }
        public string Month {
            get;
            set;
        }
        public int Value {
            get;
            set;
        }
    }
    public class Series_wise_Product {
        public string seriesName {
            get;
            set;
        }
        public int SeriesValue {
            get;
            set;
        }
        public string link {
            get;
            set;
        }
    }
}
The GenerateData Web Service will fetch chart data mentioned above. The data will be formatted according to the prescribed JSON structure of FusionCharts.

Step 5

Open Web.config file and add the code given below.
<connectionstrings>
    <add name="constr" connectionString="data source=(LocalDB)\MSSQLLocalDB;attachdbfilename=|DataDirectory|\Product.mdf;integrated security=True;MultipleActiveResultSets=True;"></add>
  </connectionstrings>
The structure of the above code should be:

Step 6

Right click -> Select GenarateData.asmx. A page will be displayed in the browser.Click Invoke to execute getData web method which would return the following output.It returns the FusionCharts prescribed JSON data source for the chart as string.

Step 7

In this step we’ll Add Service Reference. Right Click on References and select Add Service Reference options as shown below.An Add Service Reference dialog box will open. Click DiscoverMention GenerateData in the Namespace.

Step 8

Click Advanced… for adding Web References (Refer to the previous image). It opens the Service Reference Settings dialog box as shown below.Click Add Web Reference… to add Web Reference instead of Service Reference.An Add Web Reference dialog box will be displayed as shown below.Next, select the Web Services in this solution link. It opens the following dialog box.Click Add Reference to add the reference. The above step will add the web reference to the solution hierarchy as shown below.

III. Creating a ASP.NET web page for consuming the created Web Service

The last step for completing the entire process is to create the client web page (.aspx) for consuming the created Web Service.

Step 1

Right click -> Project -> Add New Item as shown below.

Step 2

Add New Item dialog box opens as shown below. Select Web Form from the template and name it as Index.aspx.

Step 3

Add the following code to the Index.aspx file.
< !DOCTYPE html>

<html xmlns="http://www.w3.org/1999/xhtml">

<head runat="server">
    <title>Rendering FusionCharts fetching data from web service</title>
    <script type="text/javascript" src="http://static.fusioncharts.com/code/latest/fusioncharts.js"></script>
    <script type="text/javascript" src="http://static.fusioncharts.com/code/latest/themes/fusioncharts.theme.zune.js"></script>
</head>

<body>
    <form id="form1" runat="server">
        <div>
            <h2>Rendering FusionCharts fetching data from web service</h2>
            <asp:literal ID="l1" runat="server"></asp:literal>
        </div>
    </form>
</body>

</html>

Step 4

Right Click -> References ->Add References. It adds reference to FusionCharts.dllAdd References dialog box opens as shown below.Browse and select FusionCharts.dll. Click Ok

Step 5

Add the code to Index.aspx.cs file. This file is present in the Page_Load event handler.
GenerateData.GenrateData data = new GenerateData.GenrateData();

string str = data.getData();
Chart cc = new Chart("mscolumn2d", "mychart", "750", "550", "json", str);
//Rendering chart by calling Render()
l1.Text = cc.Render();
Add the following NameSpace reference as well.
using FusionCharts.Charts;

Step 6

Right click -> Index.aspx-> Select Set As Start Page as shown below.So, we are done with all the steps to integrate FusionCharts with net web service.

Step 7

Press Ctrl + F5 to execute index.aspx. Your output should look similar to the image shown below.If you find any difficulty in rendering the chart or you see any error in your code, click here to download the complete source code of the sample project we have created for this tutorial.

Take your data visualization to a whole new level

From column to donut and radar to gantt, FusionCharts provides with over 100+ interactive charts & 2,000+ data-driven maps to make your dashboards and reports more insightful

Explore FusionCharts

Leave a comment

Your email address will not be published.

This site uses Akismet to reduce spam. Learn how your comment data is processed.

Your next great dashboard starts here

With our interactive and responsive charts, extensive documentation, consistent API, and cross-browser support - delight your customers with kick-ass dashboards

Explore FUSIONCHARTS