FusionCharts for Flex v1.1 is here. This release is special, as gauges and charts from FusionWidgets have been introduced in FusionCharts for Flex. Built on FusionCharts v3.1 framework, the new version is packed with a wide range of new and exciting features. Here’s a brief overview of the new features in FusionCharts for Flex v1.1.
Data visualization tools play a critical role in the day-to-day operation of most small and large businesses. They are important for monitoring routine operations and delivering key company insights and employee performance. They also empower decision-makers to make informed decisions and make strategic plans for the future.
When you are deciding which data charting and graphing library is best for your organization, you will find there are many tools on the market. Even Google has Google Charts for exactly this purpose. However, for many reasons developers and data scientists are switching to a Google charts alternative.
That alternative is FusionCharts, a beautiful and incredibly fast data presentation library. FusionCharts offers intelligent features that take your data visualization experience to a whole new level. Here is a guide on how to get more results out of FusionCharts, the great Google Charts alternative.
 FusionCharts is the best library for data visualization. Not only does it efficiently and accurately plot data points, it also has beautiful and effective user interfaces. It is a great Google Charts alternative when it comes to reliability, ease of use, customizability, responsiveness, interactive interfaces, and much more.
 Of course! Compared to Google charts, FusionCharts allows all kinds of user interactions. Google Charts has no support for panning, zooming, scrolling, and drill-downs. FusionCharts, on the other hand, provides all these features in addition to support for interactive legends, informative tooltips, and intelligent label management. It also has annotations, custom themes, and additional on-chart drawing tools.
If you want to learn more, then visit the FusionCharts Feature Showcase.
Of course! Compared to Google charts, FusionCharts allows all kinds of user interactions. Google Charts has no support for panning, zooming, scrolling, and drill-downs. FusionCharts, on the other hand, provides all these features in addition to support for interactive legends, informative tooltips, and intelligent label management. It also has annotations, custom themes, and additional on-chart drawing tools.
If you want to learn more, then visit the FusionCharts Feature Showcase.
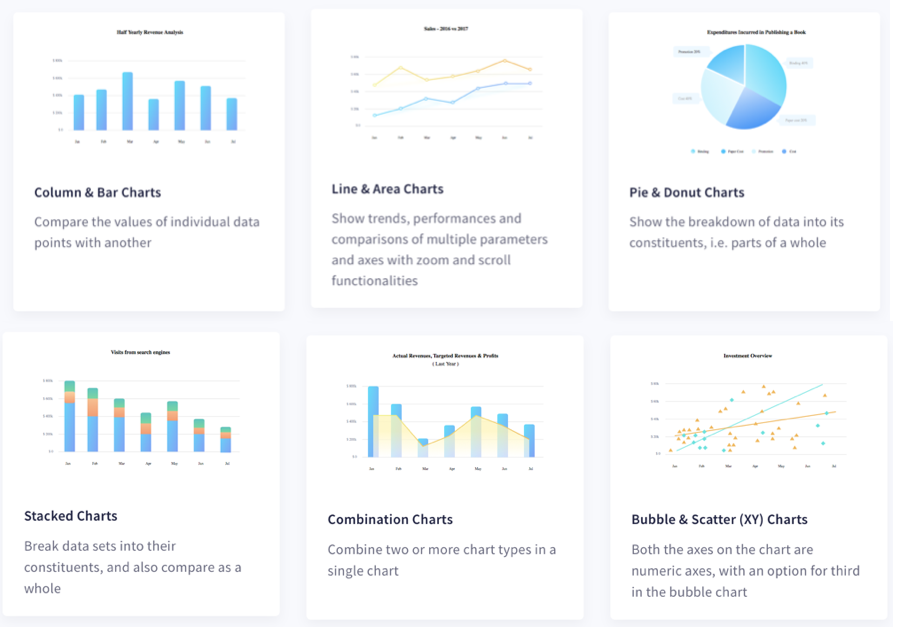 Yes absolutely! FusionCharts supports a wide variety of charts, gauges, and data-driven maps. With Google Charts, however, you can only create the more commonly used and popular charts. The more domain-specific charts are not available. With FusionCharts you can make Marimekko charts to depict market shares, Pareto charts that combine line charts and column charts, Funnel and pyramid charts to plot streamlined data, and Sunburst charts for hierarchical data. Furthermore, FusionCharts also supports 3D charts as well as real-time charts that live stream data. To learn more, explore 100+ charts and 2000+ maps.
 A data visualization tool that offers out-of-the-box solutions cannot possibly have options for every project requirement. Because of this, customizability is a very important part of any charting or graphing library. FusionCharts always keeps the needs of all its customers in mind. That is why it gives you the flexibility to configure everything from axis labels to legends, chart colors, and styles. You can even customize themes, change the size of visualizations, add custom annotations, and add captions and sub-captions. To learn more, visit Customize Data Plots.
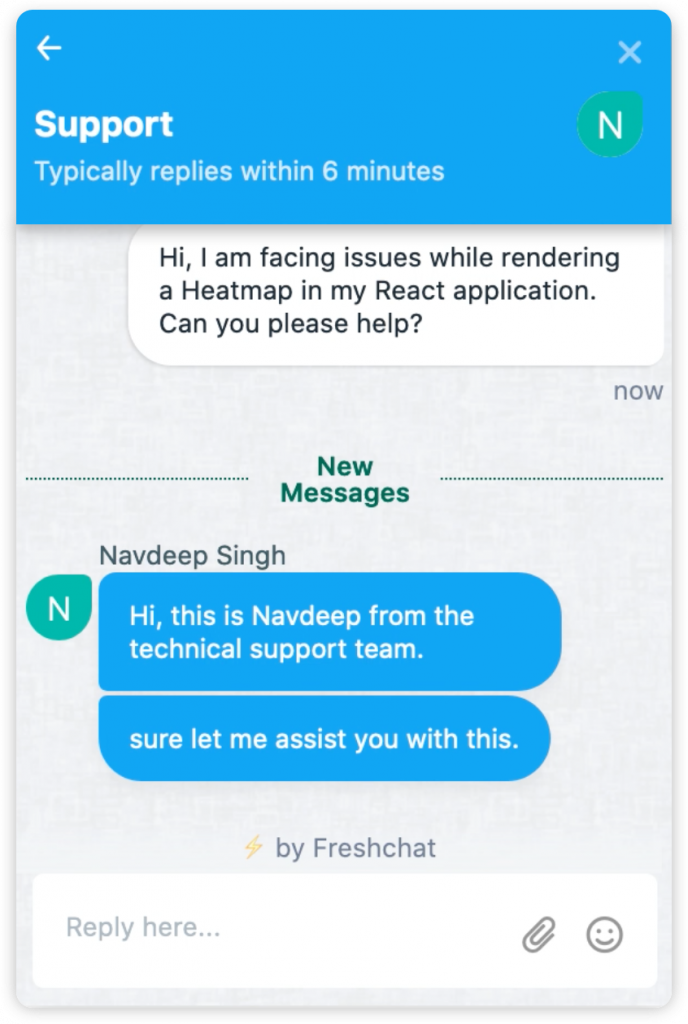 FusionCharts has a dedicated support team available 24/7 over email, live chat, and dedicated forums. When stuck with an issue, you can get an immediate response within minutes — you don’t have to wait for days to get a reply on GitHub. In addition to reliable support staff, FusionCharts comes with extensive documentation and code examples for all types of frameworks. There are also complete code examples and tutorials on implementing different business dashboards using various technologies. All tutorials support the standardized ES6 conventions enabling you to implement them into your project right away. Explore more tutorials, examples, and dashboards.
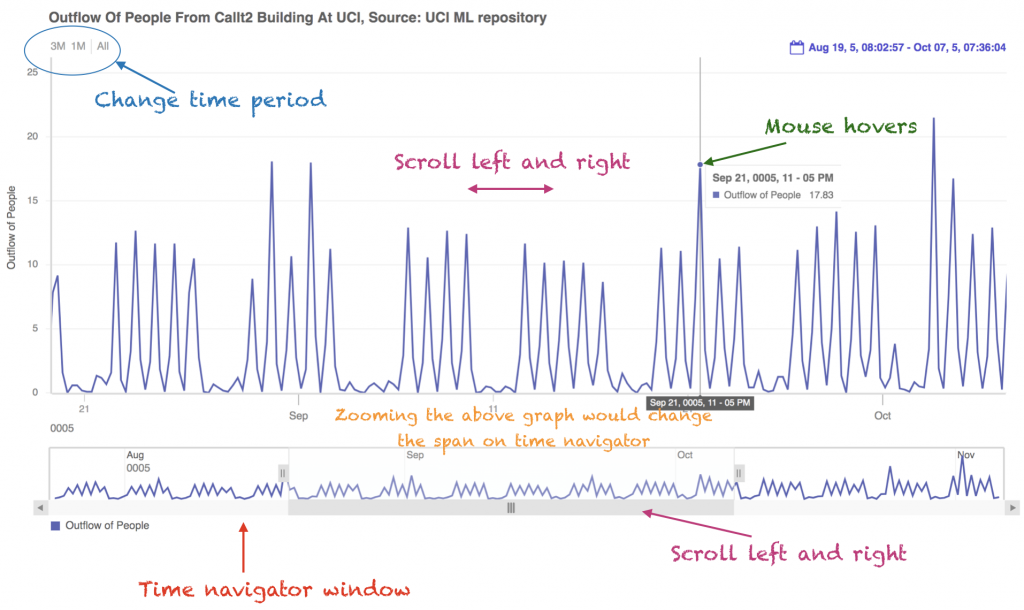 Large datasets with millions of records are increasingly common. Because of this, we optimized FusionCharts to handle millions of data points with high-quality performance. It also has built-in functionality like time navigator, date range selectors, tooltips with crosslines, for plotting massive volumes of data. Moreover, your users can scroll, pan, and zoom to get detailed insights or summarized views. Learn more by visiting FusionTime.
Table of Contents
Exciting Gauges and Charts from FusionWidgets
In addition to the 45 chart types it already provided, FusionCharts for Flex v1.1 now also provides 12 charts from FusionWidgets – 7 gauges including angular gauge, linear gauge, LED gauge and the like; spark charts and bullet graphs. All gauges support real-time update and can even display live messages streamed from a server. Gauges are extensively used in financial applications, instrument panels and executive dashboards.
Angular Gauge

Linear Gauge

Horizontal LED Gauge
Bullet charts and spark charts have also been introduced for implementation on complex dashboards where space is a major concern. Bullet graphs are smaller information-intensive forms of bar and column charts meant for visualizing a single parameter. Spark charts are minuscule charts that can be embedded in-line with text. Essentially, spark charts are miniaturized versions of conventional column and line charts and can be positioned strategically to create maximum impact.

Bullet Graph

Multiple Sparklines
New Features in FusionCharts for Flex v1.1
Apart from new gauges and charts, FusionCharts for Flex v1.1 offers an exhaustive range of new and exciting features. Thanks to FusionCharts v3.1 framework, all charts now have a native support for client-side export to image (JPEG & PNG) or PDF. Export of plotted data to CSV format is also supported. In this release of FusionCharts for Flex, further improvements have been made to features which had been introduced in the earlier version. For instance the previous version of FusionCharts for Flex allowed incorporation of foreign language text on charts – however, rotation of such text was not possible. This limitation has now been removed. A whole host of dedicated features have been provided for enhancing customizability. A significant enhancement in this respect is support for branding – company logo can now be incorporated on charts. Custom positioning of the logo is possible and it can even be turned into a hotspot. Another exciting enhancement is the option to substitute the default content of data plot value labels with custom text.
Which Charts Library is Superior To Google Charts?
FusionCharts is the best library for data visualization. Not only does it efficiently and accurately plot data points, it also has beautiful and effective user interfaces. It is a great Google Charts alternative when it comes to reliability, ease of use, customizability, responsiveness, interactive interfaces, and much more.
Can FusionCharts Beat Google Charts in Terms of User Interaction?
Of course! Compared to Google charts, FusionCharts allows all kinds of user interactions. Google Charts has no support for panning, zooming, scrolling, and drill-downs. FusionCharts, on the other hand, provides all these features in addition to support for interactive legends, informative tooltips, and intelligent label management. It also has annotations, custom themes, and additional on-chart drawing tools.
If you want to learn more, then visit the FusionCharts Feature Showcase.
Is FusionCharts a Google Charts Alternative in Terms of Variety of Charts?
Yes absolutely! FusionCharts supports a wide variety of charts, gauges, and data-driven maps. With Google Charts, however, you can only create the more commonly used and popular charts. The more domain-specific charts are not available. With FusionCharts you can make Marimekko charts to depict market shares, Pareto charts that combine line charts and column charts, Funnel and pyramid charts to plot streamlined data, and Sunburst charts for hierarchical data. Furthermore, FusionCharts also supports 3D charts as well as real-time charts that live stream data. To learn more, explore 100+ charts and 2000+ maps.
Is FusionCharts More Customizable than Google Charts?
A data visualization tool that offers out-of-the-box solutions cannot possibly have options for every project requirement. Because of this, customizability is a very important part of any charting or graphing library. FusionCharts always keeps the needs of all its customers in mind. That is why it gives you the flexibility to configure everything from axis labels to legends, chart colors, and styles. You can even customize themes, change the size of visualizations, add custom annotations, and add captions and sub-captions. To learn more, visit Customize Data Plots.
Is There a Google Charts Alternative that Allows Event Handling?
FusionCharts, the Google Charts alternative, has awesome event handling capabilities. You can write your own listeners for almost every type of event related to data loading and updating. It also supports mouse and keyboard events so you can create highly responsive and interactive charts and graphs. Compare this to Google Charts, which has no support for lifecycle events, plot events, and data events. In contrast, FusionCharts lets you add functionality for annotation events, plot events, legend events, slicing events, chart label events, data events, and much more. Learn more on how to work with events/APIs.What Kind of Support and Documentation is Available for FusionCharts?
FusionCharts has a dedicated support team available 24/7 over email, live chat, and dedicated forums. When stuck with an issue, you can get an immediate response within minutes — you don’t have to wait for days to get a reply on GitHub. In addition to reliable support staff, FusionCharts comes with extensive documentation and code examples for all types of frameworks. There are also complete code examples and tutorials on implementing different business dashboards using various technologies. All tutorials support the standardized ES6 conventions enabling you to implement them into your project right away. Explore more tutorials, examples, and dashboards.
What About Data Loading Capabilities?
Large datasets with millions of records are increasingly common. Because of this, we optimized FusionCharts to handle millions of data points with high-quality performance. It also has built-in functionality like time navigator, date range selectors, tooltips with crosslines, for plotting massive volumes of data. Moreover, your users can scroll, pan, and zoom to get detailed insights or summarized views. Learn more by visiting FusionTime.