FusionCharts makes it easy for developers to create beautiful charts for web and mobile platforms. Today we are excited to announce the FusionCharts 3.19 and FusionTime 2.7 release!
This release includes many highly requested features, enhancements, and quality improvements, making our charts more robust, accessible, and user-friendly.
In this blog post, we’ll go over the key features of FusionCharts 3.19 and FusionTime 2.7, as well as offer some interesting and well-explained examples! We hope you are as excited as we are to discover what we have in store for you in this gleaming new release. Let’s get started
Table of Contents
✨ What’s New 🚀
1. New chart type: Grouped stacked bar chart
This new chart type is one of our stacked bar charts. Similar to other stacked charts, it helps users represent data values as a sum of two or more values. To render this chart in your application, set the “type” attribute to “MSStackedBar2D.”
The advantage of this new chart type over the “Stacked Bar 2D Chart” is the ability to display multi-dataset groups.
See the Pen GroupStacked2dChart(QE-SUPPORT-2051)-4 by FusionCharts (@fusioncharts) on CodePen.
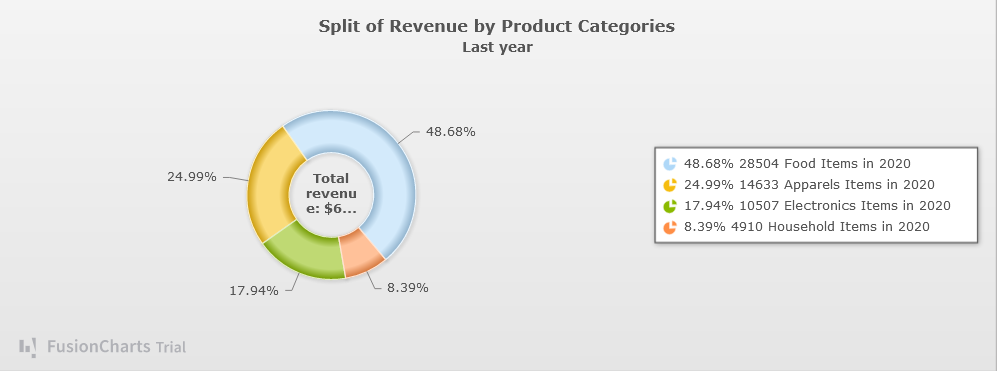
2. Support percentage values in pie and doughnut charts
With FusionCharts 3.19, you can display the percentage values in the pie and doughnut charts legend instead of the absolute value. This highly requested feature will give your users a clearer picture of the data representation by allowing them to compare chart slices easily.
Set the showpercentvalues attribute to “true” or “1” to benefit from this feature.
See the Pen (SUPPORT-2080) 5 by FusionCharts (@fusioncharts) on CodePen.
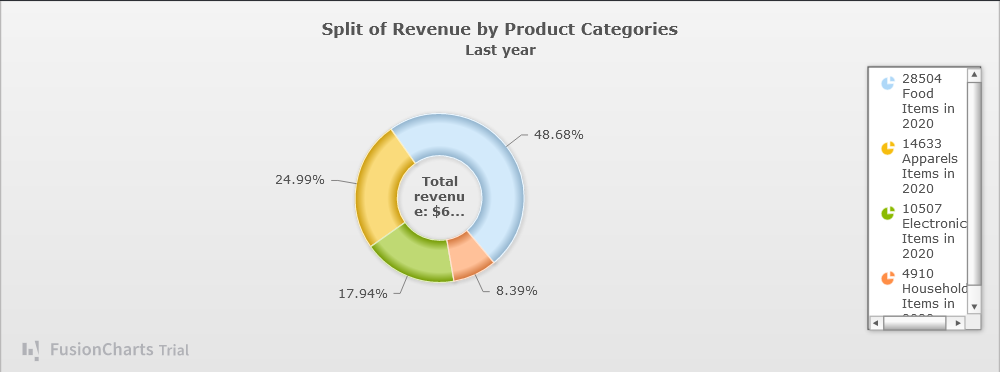
3.Control chart legend container width
The FusionCharts team considers small details into account and focuses on making charts beautiful and responsive. That’s why FusionCharts 3.19 introduces the legendWidth attribute in all chart types, which allows users to define the legend container’s width.
With this feature, the legend container content will no longer be hidden by scroll bars. Update to the latest release and use this enhancement to improve your FusionCharts’ readability.
<!–
 |
 |
| V 3.18 | V 3.19 |
–>
✨ What’s Improved 😀
1. Improvements for Angular and React-Native components
FusionCharts supports 14 front-end frameworks and back-end languages through easy-to-use components. We have verified and validated that FusionCharts versions 3.19, 3.18, and 3.17 support Angular versions (11, 12, and 13) and React versions (16, 17, and 18).
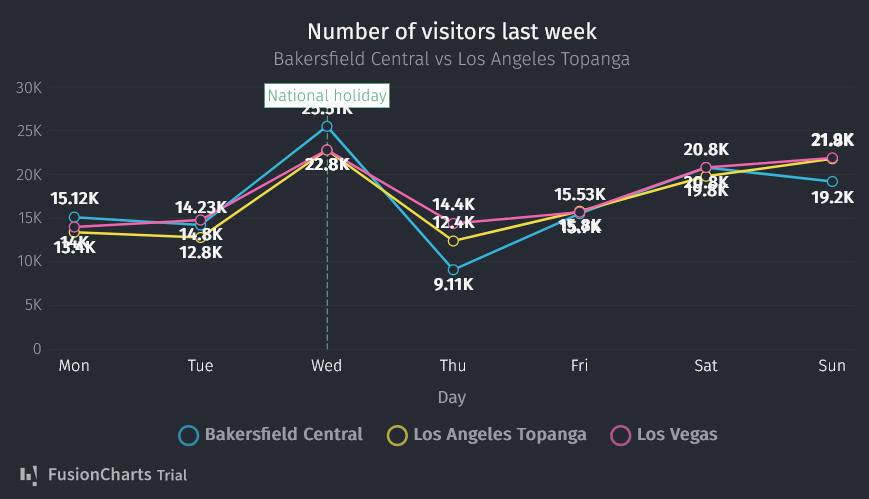
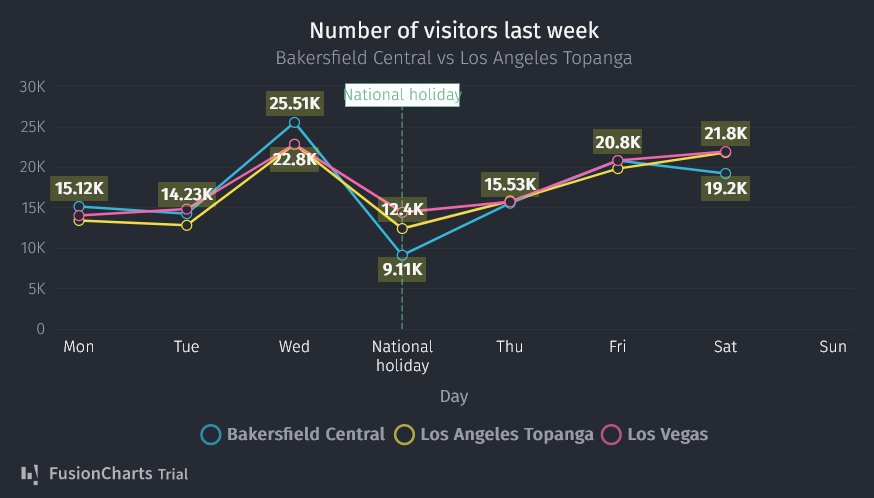
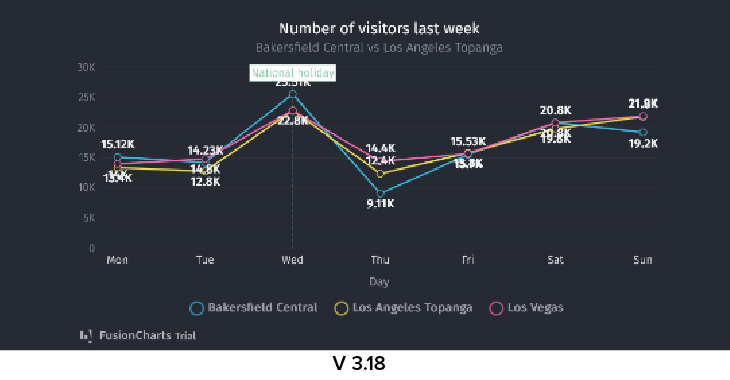
2. Improve the Readability of Multiseries Charts
With the update of FusionCharts 3.19, the data plots with the same or similar values in the Multiseries charts never overlap. The code is written such that if you have collisions between series, it will automatically detect them and separate them accordingly.
The charts data will be easier to read as a result of this improvement.
<!–
 |
 |
| V 3.18 | V 3.19 |
–>
<!–
 –>
–>
… and much more!
In this post, we covered only some of the new features and improvements that FusionCharts 3.19 has to offer. You can view the full list of the changelog here.
Are you ready to give it a try?
Download
We hope you’ll enjoy the new features, enhancements, and quality improvements in this latest release. Download the trial version of FusionCharts 3.19 today.
Buy Now!
Ready to buy or upgrade? Get started here.
We love hearing your feedback! For any questions or suggestions, drop us an email at [email protected].
Don’t forget to stay tuned! As we speak, we are preparing the next releases for FusionCharts —keep your eyes peeled for more blog posts detailing everything you need to know about our next releases.
Happy Charting! 🙂