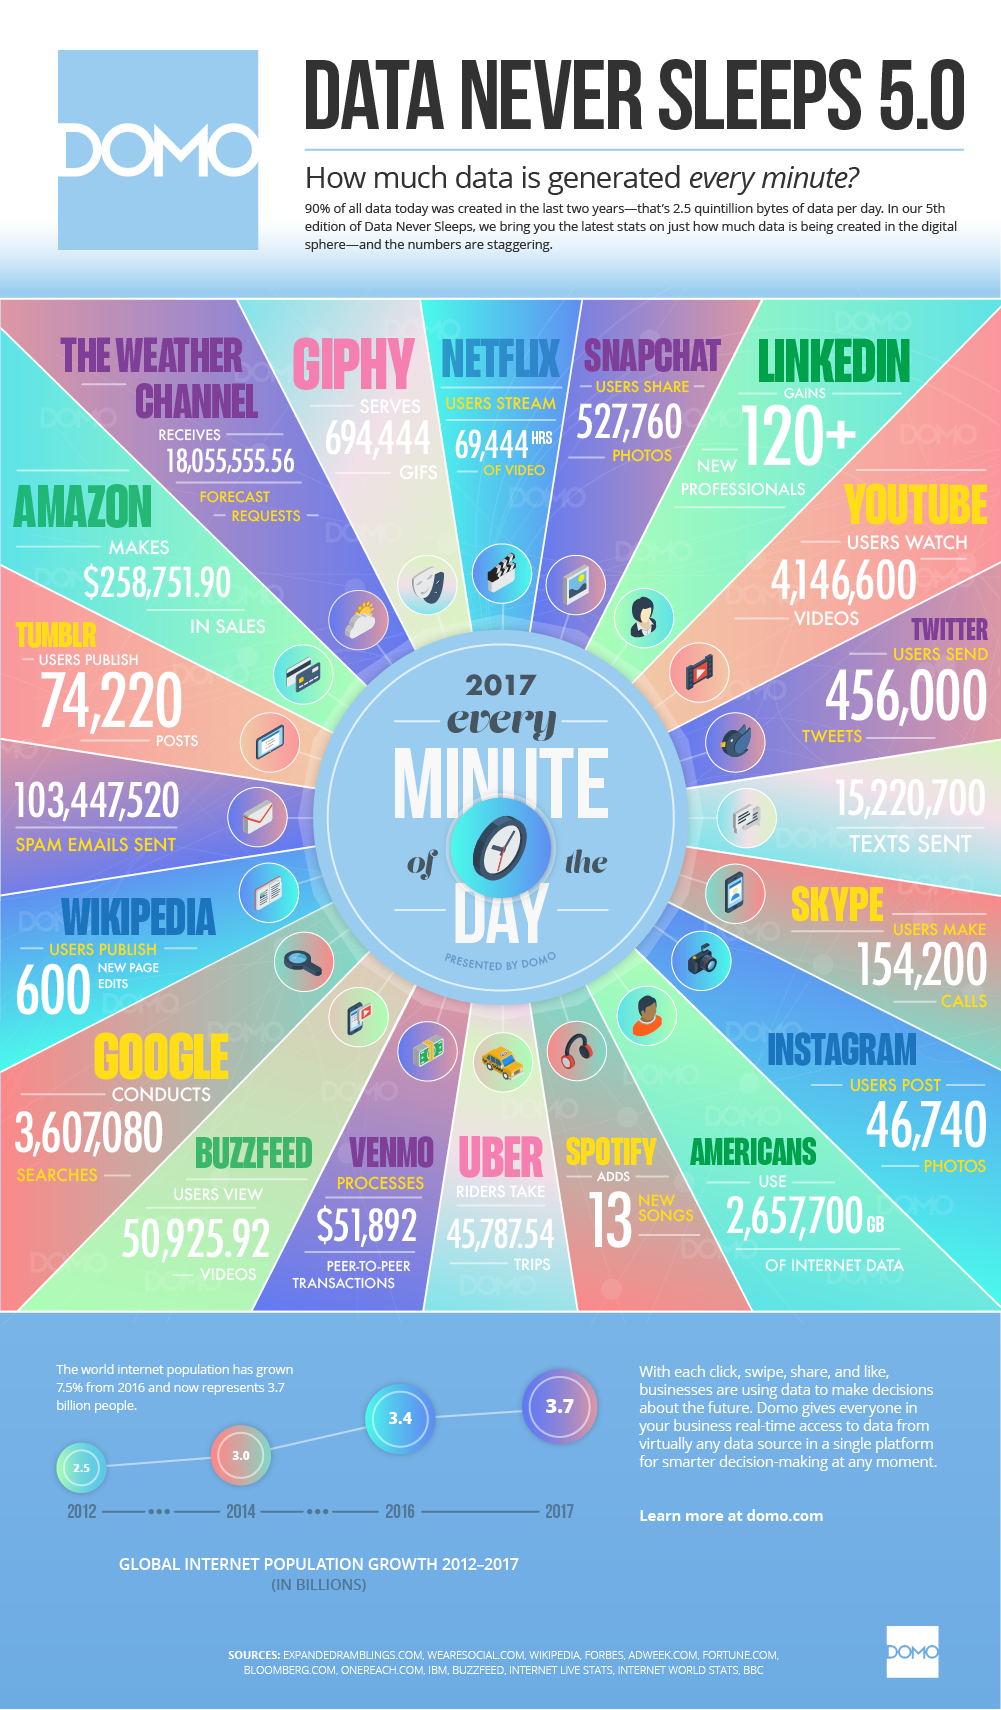
Every day, more than 2.5 quintillions (that’s 18 zeroes!) bytes of data are recorded in today’s world. As a result, most data storage systems are filling up at an exponential rate, necessitating the use of far more data centers. What we must remember is that each of these data records has a time element associated with it, which opens up new avenues for gathering insights.
In this post, we’ll help you understand the benefits of data, how to create Time Series Visualization, handle large volumes of time series data, and the advantages FusionTime brings to the table for creating insightful and beautiful Time Series Charts and Interactive Graph and a lot more.
Table of Contents
The Benefits of Understanding the Data
All of this data is not being stored pointlessly, though, it has a purpose – and one which changes with every user. Organizations want to serve their customers better, and academicians want to understand real-world observations. Also, governments want to run better welfare programs, and developers want to make better algorithms and systems. All people, in general, want to live life with better clarity and make informed decisions.
So, can only recording data enable this? Certainly not! Recording data is just the start of the process – they call it data capturing or data gathering. The real fun starts after this when we try and understand the data. To understand anything, we should know its fundamental nature. Fundamentals of data include – measures, dimension, and time. Although measure and dimension may sound ambiguous to normal users; they immediately understand time – you know, “when was this data recorded?” All data storage systems store data against a timestamp.
Understanding this mammoth of data is not easy. The pool of data analysts, data scientists, and data viz experts spend their entire careers enabling people to make better sense of their data. They often tend to represent data in a visual form. Visual displays make the understanding easy for the common man too. Even amongst all visualizations, Time Series Charts have always been a popular theme.
FusionTime, a product by FusionCharts focuses solely on Time Series Charts.
- To make the process of representing time-series data easy for data viz experts
- To enable the users to explore and find interesting time patterns in their data and sense the AHA moment!
Create Time Series Visualization on Any Browser
The web today is limited by the power of browsers. Having said that, it becomes very easy to say that better-performing time series charts will be there when the browsers become more powerful. FusionTime focuses on optimizing browser capabilities. In FusionTime, the concept of data tables ensures that the browser capacity is optimally utilized, resulting in an enhanced experience of time series charts across all browsers and devices.
Handle Large Volumes of Time Series Data
Time series data generally come in large volumes. Current time series charts often fail to effectively handle large volumes of data. FusionDataStore was primarily created to bring the prowess of handling a large amount of time-series data to FusionTime. Representing time series data is just one small part of the entire spectrum. Properly handling large volumes of data is the real secret to creating high-performance time series and stock charts.
Deal with the Curse of Missing Time Series Data
It is very important to showcase when data has not been recorded/observed for a particular time interval, in the overall time span. FusionTime does this beautifully, by showing time instances with missing data values as empty gaps. Imagine a situation when some IoT sensors, which were supposed to work in an automated environment fail to capture some observation due to some internal faulty behavior or some external disturbance like fluctuating power supply. Will it not help if such situations can be easily identified? Well, FusionTime takes care of such situations by default, to give a wholesome experience of time series visualization.
Create Customizable Time Series Charts
Each use of a time series chart is unique in itself, which creates a need to customize them, by either adding better branding elements or specific aesthetics. FusionTime has been deliberately designed with pleasing default options, which can be customized very easily. It helps developers create a unique experience for their end-users.
Want to try making awesome Time-Series Charts yourself? Download and Try FusionTime Now!
Zoom Into Your Time Series Data
Time by nature is hierarchical – months roll into a year, days roll into a month, hours roll into a day, and so on. This inherent nature of time series can be used to design zoomable time series charts. FusionTime considers this and enables the users to zoom the time series chart from the canvas area and see time series data at different zoom levels (or time scale). The x-axis of the time series charts reflects the zoom level.
Mark Time Events on the Time Series Charts
Multiple things can affect the data observation for a particular time instance. Bad weather can affect footfalls and sales in a departmental store, employee attendance is generally poor during Christmas, TRP will be high during Super Bowl telecasts, etc. Overlays on time series charts, which provide more context to the nature of the observed data can be immensely helpful. FusionTime takes care of this and represents time markers for both cyclic and acyclic events.
Annotate Important Points on Time Series Charts
Annotating flags on specific data points help in a better understanding of the chart. The reasons for spikes in stock prices, fall in interest rates, population saturation in a population growth curve, mortality rate decrease, etc. can be marked very easily on data points using FusionTime. This helps users understand the exact reason for the observed behavior in time series charts.
Benchmark Reference Values on Time Series Charts
There are situations when we want to see our time series charts against a benchmark value. For example, “on how many days does my stadium reach 80% of the sitting capacity?” A reference line can be created for such cases. The time-series data is then visualized against the reference line as an overlay. For better understanding, one can also describe the name of the reference line. Features like this, enhance the understanding of time series data and are available by default in FusionTime.
See the Data for any Time Period
Often our time series data is very large. There are situations when we want to focus on specified periods, like “last 1 year”, “quarter till date”, or even from “1, May 2018 to 23, June 2018”. Range selectors come in very handy in these situations. Standard range selectors and custom range selectors are both available as extensions in FusionTime. They are placed above the time series charts and smartly show the options which are contextual to the given period being viewed.
Effortlessly Navigate Time With Our Time Navigator
The concept of a time navigator in time series charts is in coherence with the data visualization stalwart, Stephen Few, who has vehemently propelled the idea of ‘Focus and Context’. The time navigator is placed below the time series chart and shows the trend of all the time series data. The active window shows the time period that interests the user. It comes as an overlay on the time navigator with handlebars. Users can drag the handlebars to change the focussed time period in the time series chart.
Want to try making awesome Time-Series Charts yourself? Download and Try FusionTime Now!