The business intelligence software combined with analytics and reporting tools perform a variety of important and useful functions during the different stages of a business lifecycle. Along with collecting data from different business processes, they also gather large volumes of data from a diverse set of resources such as the internet, journals, books, videos, images and more. They preprocess raw data into a more structured format that can be used for further processing and analysis. This cleaned version of data can be used to build data stories, dashboards and data visualizations.
Besides different methods of data presentation, business intelligence software and tools are also used for data mining, data monitoring, forecasting trends and predictive modeling. They are now an inherent part of all small and large enterprises with an undeniably important role in making important future business decisions. To this end, it is essential to determine the major game players for reporting and analytic tools available in the market today. For the year 2026, we are seeing more and more organizations turn to Yellowfin, which is the preferred choice for reporting and analytics tools.
Table of Contents
Why is Yellowfin the Preferred Choice for Analytics and Reporting Tools?
Yellowfin has been recognized as the leader in business analytic solutions for the past 15 years. Many reasons guarantee return on investment including new business capabilities, faster time to market and full control over cost. Yellowfin’s innovative solutions and capabilities take the dashboards and reporting tools to a whole new level. Continue reading to discover a few of Yellowfin’s features and products.
What is Yellowfin’s Guided Natural Language Query?
Yellowfin’s Guided Natural Query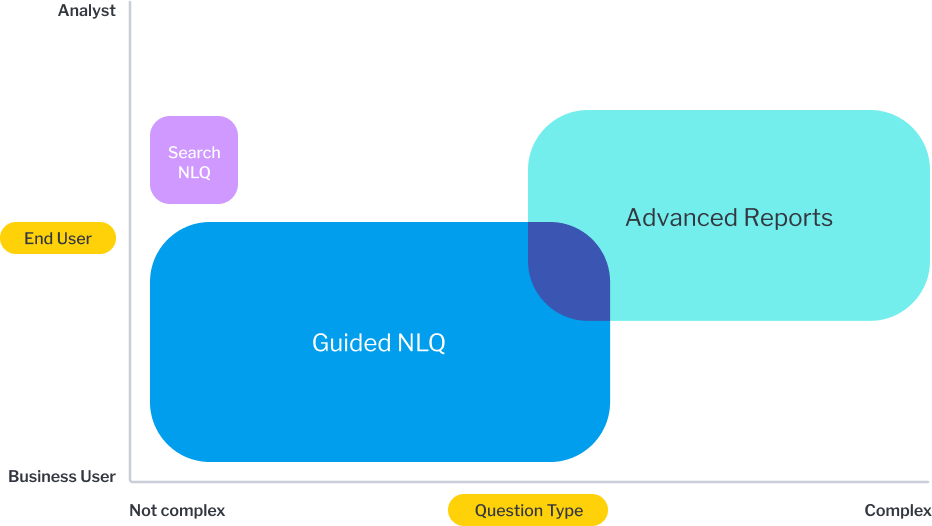 (NLQ) feature that allows users to specify English language based syntax for developing ad-hoc reports. This empowers business leaders to foster a data-driven culture and help drive informative and educated decision-making based on the facts portrayed by data.
What is Yellowfin’s Data Story Telling Module?
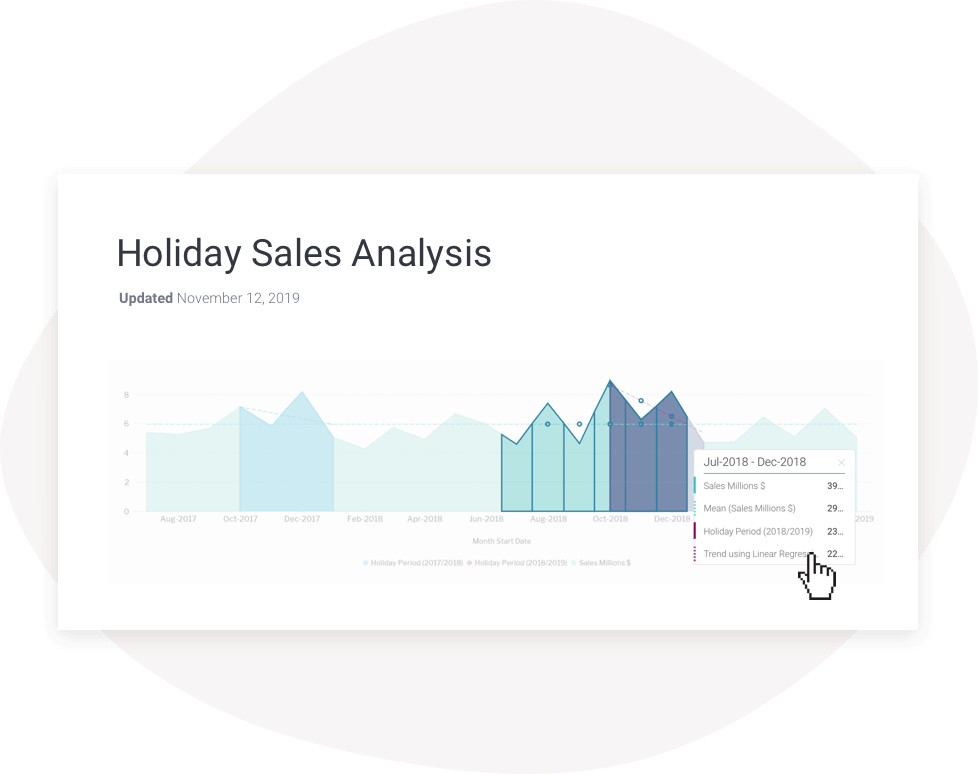
The awesome data story telling module is Yellowfin’s proprietary collaboration analytics solution to a deeper and enhanced understanding of your data. You have the option to use Yellowfin Stories or Yellowfin Present. Yellowfin Stories has the capacity to alter how people consume and learn from data. They can share knowledge and insights in a news-like style, especially tailored for mobile. This keeps everyone updated and on the same page.
Yellowfin present allows you to create accurate data-led presentations and management and financial reports. The unique feature in these presentations is that data is accurate 24/7 with a dynamically updating feature. Executives, managers and CEOs can view the reports anytime while having the confidence that the data is up-to-date.
How does Yellowfin Deliver Automated Business Monitoring?
Automated business monitoring (ABM) is also known as automated analytics or automated reporting. This feature allows your analytics software to auto-detect and auto-monitor trends and patterns in data. It also adds the capability to detect anomalies and deviations in data. Yellowfin’s signals uses complex ranking algorithms in the background to not only identify the most relevant deviations in data but also pinpoint where they occurred.
What are the Embedded Solutions Provided by Yellowfin?
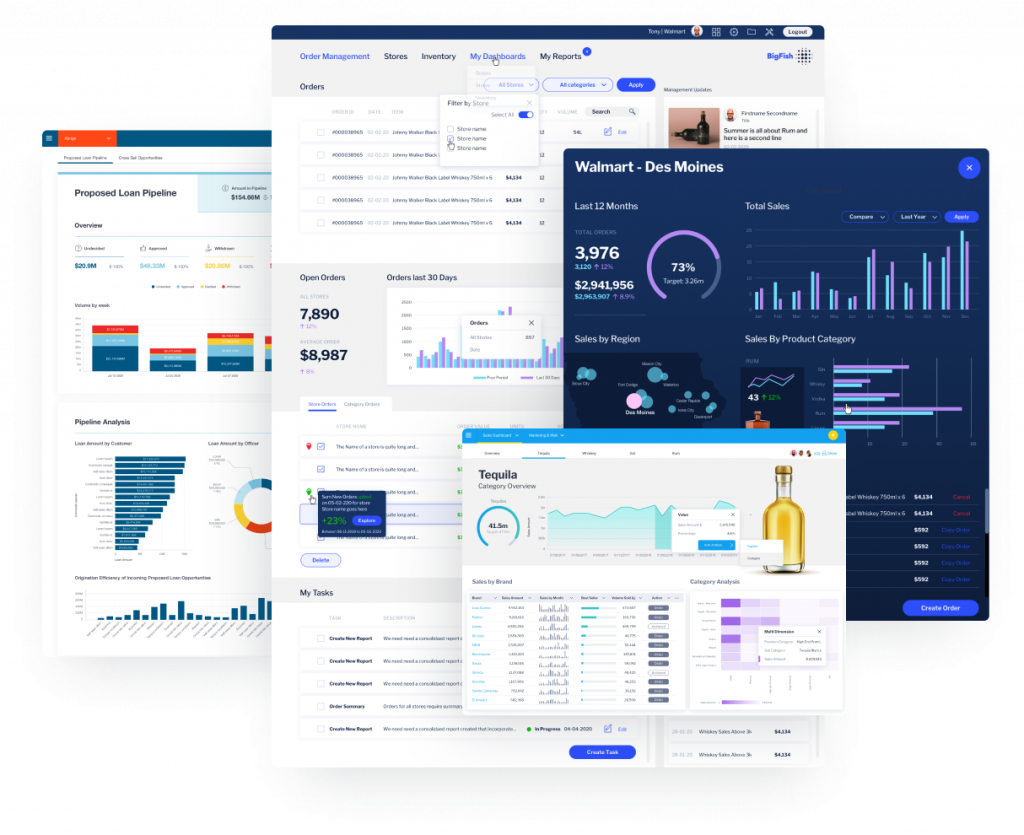
If you are a software company, Yellowfin empowers you to embed world class dashboards and analytics into your software. You can give your clients access to their data in the form of stunning dashboards and charts. Yellowfin provides pre-built dashboards that deliver important automated insights. You can seamlessly integrate them into the software you are building.
You can also enable your clients to build their own ad-hoc reports by using Self Service business intelligence. Yellowfin’s intuitive self-service BI options accelerate discovery and allow everyone to share insights in a governed way.
With Yellowfin, there is also the contextual embedding option that helps you incorporate visualizations or dashboards directly into your application’s workflows. Additionally, the Yellowfin’s APIs allow you to add reports, charts and dashboards to your software with minimal code.
What is Yellowfin’s Mobile BI?
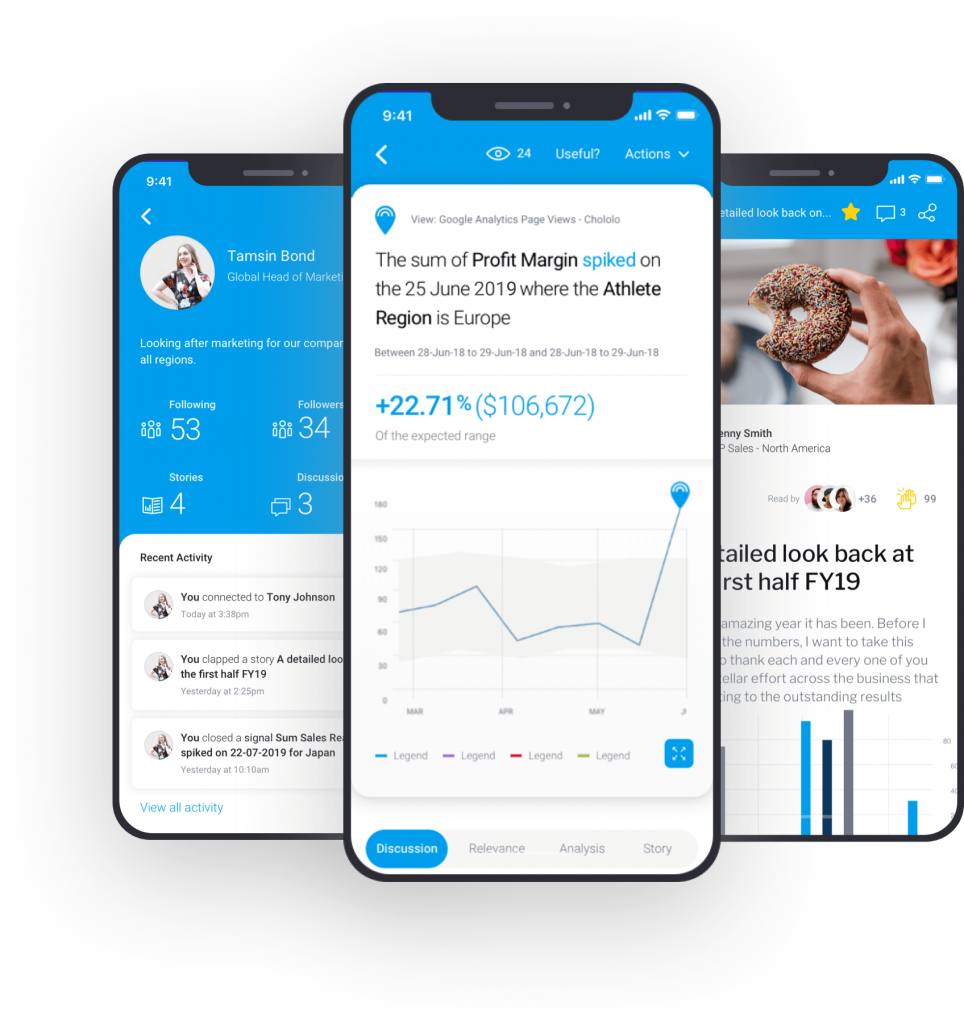
Yellowfin’s dedicated team of professional have optimized its design to runs on all types of mobile platforms. Users can now access their data anywhere anytime. You can now discover, collaborate, monitor and take data-driven actions using the Yellowfin’s mobile app. Yellowfin empowers you to develop a data driven culture and enrich your business decision making processes by letting data be its main driving force.
Which Database can I Use to Leverage Yellowfin’s Analytics and Reporting Tools?
With Yellowfin, you don’t have to use a proprietary database. You are certainly free to choose any source of data, and query its records without having to move it. Whether its analytic databases like Google Big Query, Redshift, SAP Hana or the likes, or relational database like MySQL, HSQL, SQLite or more, Yellowfin has you covered. You can even use data from your spreadsheets, which act like any other data source.
How can I Optimize My Business Processes with Analytics and Reporting Tools?
You can certainly optimize various business processes by leveraging the Yellowfin’s analytics and reporting tools. Yellowfin’s action based dashboards, data story telling and automated discovery tools can let data be a driver for automated monitoring of various processes and future decision making. You can drive revenue growth and assist your customers more efficiently with improved services.
Which Charting Libraries can I Use With Yellowfin?
Our dedicated team of developers have made major additions and upgrades to Yellowfin. With version 7.3, you can bring all your external Javascript libraries into its platform. Developers can integrate their favorite Javascript chart libraries directly into the Yellowfin’s framework. Moreover, they can write their own code to customize and style the charts and graphs according to their special requirements. Yellowfin’s Chart Builder directly incorporates this functionality. So now you can leverage Yellowfin’s enterprise security, governance, and content migration features using your favorite Javascript charting library.
Where can I Learn More to Develop Powerful Business Solutions With Yellowfin and FusionCharts?
FusionCharts (our powerful data visualization tool) is a library (with many SDKs for many programming languages) for creating beautiful and stunning charts, gauges and maps. You can leverage the power of Yellowfin’s analytic and business intelligence capabilities together with FusionCharts’ aesthetic, visually appealing and effective data visualizations. This certainly results in increased efficiency, enhanced productivity and better decision making. Choose Yellowfin integrated with FusionCharts to empower your enterprise customers with off-the-shelf and ready-to-use analytic solutions for delivering insights and developing a data-aware and data-driven culture for increased productivity and optimized business processes.
Explore more of Yellowfin features and sign up for your free trial today!
