Data is undoubtedly one of the most crucial commodities of our time. Harnessing and analyzing data to better understand phenomena has contributed significantly to our technological advancement. It has been critical in helping us deal with the ongoing pandemic and discovering a vaccine in record time. Industries and researchers continuously use data to achieve breakthroughs that would otherwise have taken much more time to discover.
Along with an enormous increase in data collection and analysis, there also has been an incredible push for better data literacy and communication. The general population has begun to try to understand all the data that they come across. With the internet as their source and guide, the layman is vastly more aware of how data is used or even abused.
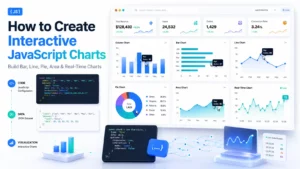
With a significant rise in demand for effectively communicating data patterns and trends, the demand for robust data visualization tools has also grown. Such tools generate visually clear and interactive visualizations. They also make it easier to share and show them. Most people tend to lean towards web-based frameworks like FusionCharts that can seamlessly integrate into their websites.
This article will explore the biggest trends in data visualization this year, especially charts. It will show you how we are using these tools to communicate data more effectively.
Table of Contents
How Has Data Visualization Changed Over The Years?
For the longest time, our data was not as complex as it is now. Hardly any effort went into cleaning and processing the data before you could analyze it. These were times when the data could be easily communicated and visualized through simple charts and graphs. Such visualizations were static snapshots of the data and its trends, and they hardly captured the nuances.
However, we have come a long way since those times. Now we collect tremendous amounts of raw and unstructured data that often makes no sense at first. After extensive preprocessing and elaborate data pipelines, it finally becomes usable for us to analyze and learn from. Our work, however, only ends when we present our data to the world.
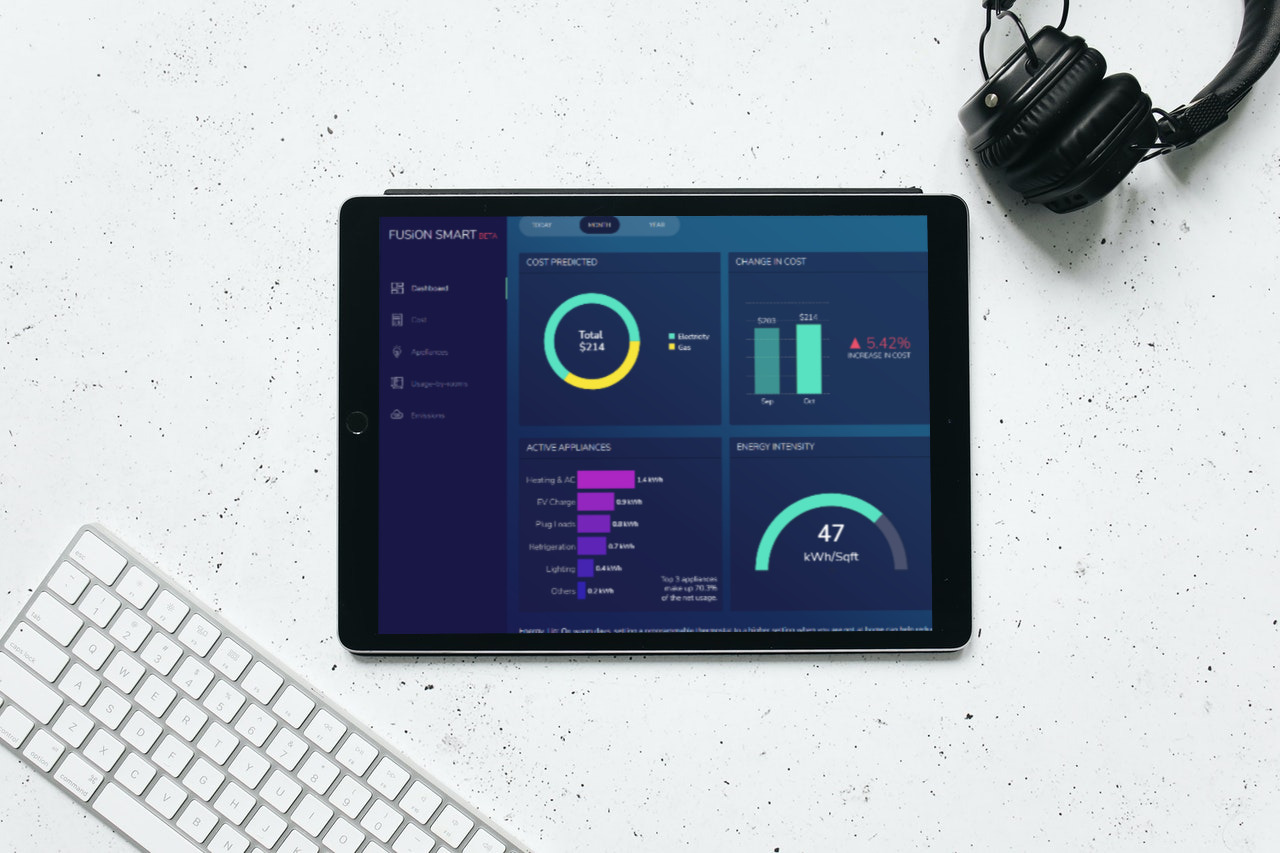
As our data needs get more elaborate, our data visualizations need to be more robust. Tools like FusionCharts allow you to embed your visualizations into your websites. In addition, you can create powerful yet visually appealing dashboards that dynamically capture the essence of data trends dynamically. The visualizations are interactive so that you can access them on any device and easily personalize them too.
What Are Some Popular Fields That Used Charts To Their Benefit?

Almost every industry or field of knowledge uses data in one way or another. Enterprises use data to understand their consumers better and optimize their operations for maximum efficiency. Data is one of the best tools for researchers as they chase one scientific breakthrough after another. All of them are prominent examples of how data has effectively transformed how we conduct business or research.
Wherever data is being used, the need for effective data visualization will inevitably arise. Here are some famous examples of data visualization (charts made using FusionCharts):
- Understanding The Advent Of Climate Change: Climate change is one of the most urgent challenges faced by humanity. There is ample data to show us, for example, how summers have gotten way hotter.
- Realizing The Severity Of Social Inequality: Our species has tried to create a just and equal society at any given point in history. However, the current times are seeing unprecedented levels of social inequality in action.
- Keeping Track Of A Pandemic & Its Effects: The level of impact the COVID-19 pandemic had on the world warranted a constant look at its dynamic state.
The above shows how intelligent data visualization is critical to properly communicating the essence and nuance hidden in your data trends. For such reasons, FusionCharts focuses on providing you with quality data visualization functionalities that work seamlessly with even vast amounts of data.
What Have Been The Most Popular Trends In Charts This Year?

This year has seen many prominent examples of data visualization being used to convey meaningful insights that have global relevance. The type of visualization is an essential part of the whole conversation regarding the phenomena they represent. Furthermore, these visualizations became examples of the effect that an intelligent data visualization strategy can have.
Understanding these visualizations and the impact they have can help you make better visualization choices for your own data. Here are the biggest trends in charts we saw this year.
Japanese Candlestick Charts
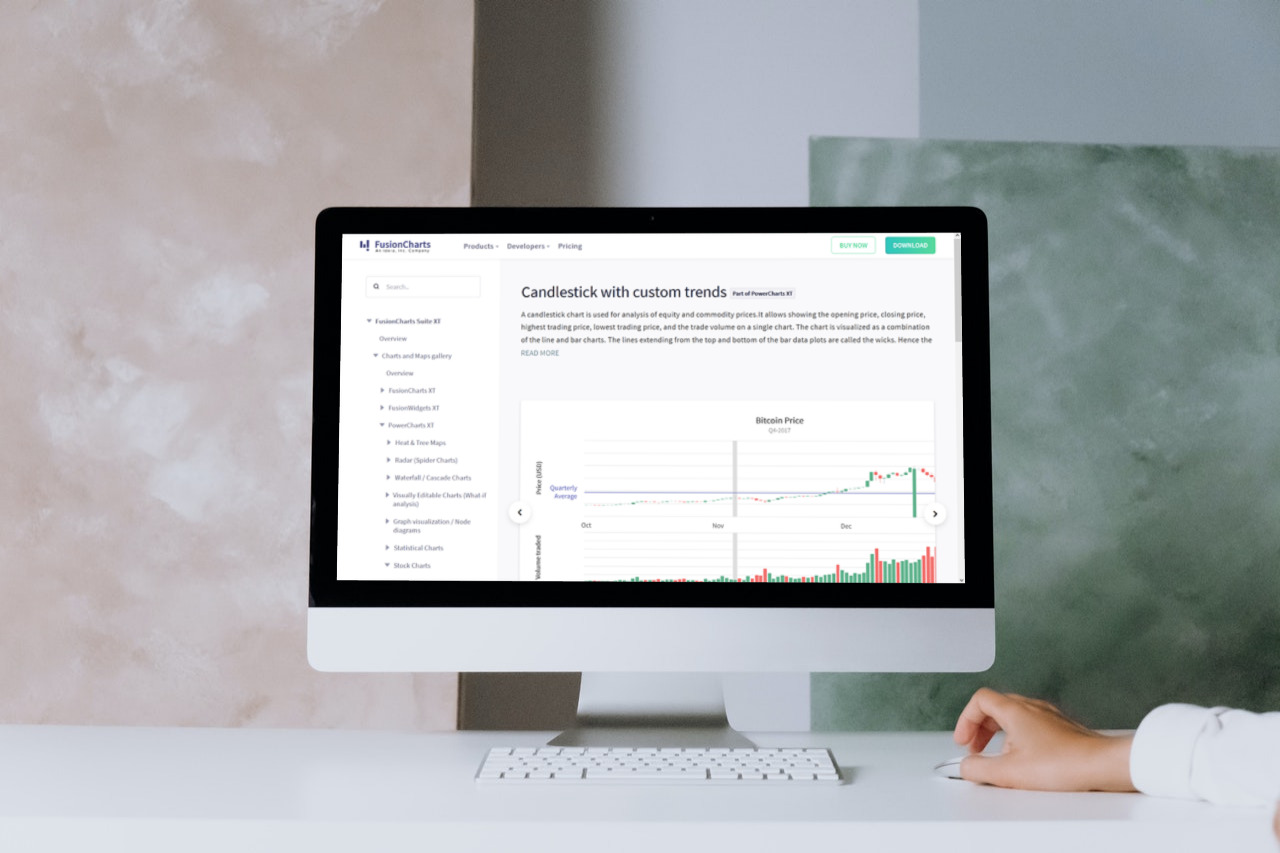
Cryptocurrency has been one of the hottest topics around the world. Analysts and market pundits saw unprecedented engagement with people enthusiastic about investing in this striking piece of technology. Innovative applications allowed crypto enthusiasts to keep a close track of their investments dynamically by using candlestick graphs.
This type of graph managed to encompass all the technicalities of the value of different cryptocurrencies. It effectively showed the statistics related to exchange rates and the general trajectory of growth or decline. The candlestick graph became hugely popular and was featured almost everywhere anyone mentioned cryptocurrencies.
Heat Maps
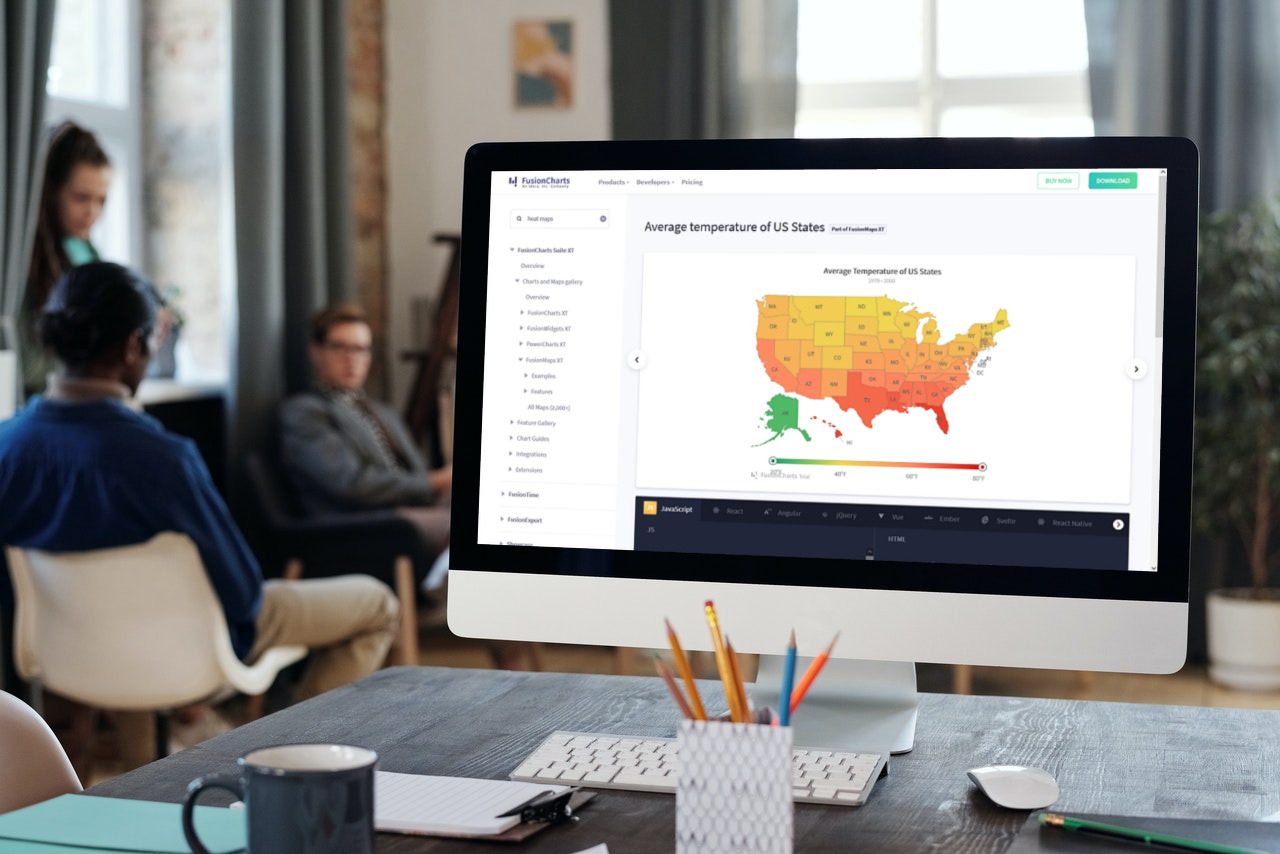
Climate change severely affected many parts of the world throughout the year. The shocking increase in wildfires and extreme temperatures pushed the conversation around climate change to a higher state of urgency. To better communicate what kind of temperature increase the world was experiencing, most researchers utilized heat maps.
This kind of graph features a geographical map colored according to the value of a specific factor related to that area. In some cases, researchers used heat maps to show just how hot certain areas were. Researchers also used them to depict the level of emissions coming from a location and how it fared compared to its neighbors.
Spline Charts
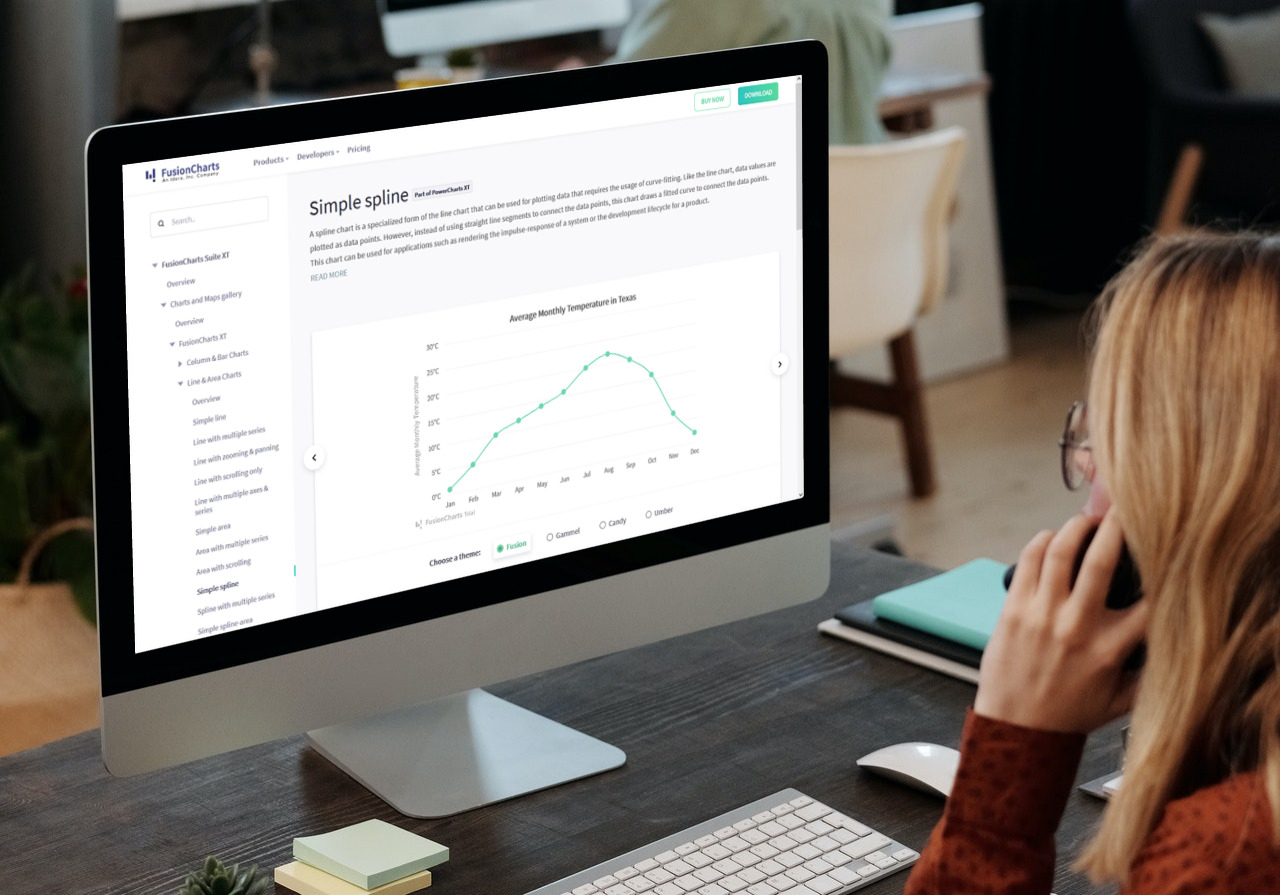
The COVID-19 pandemic saw the whole world come to a sudden halt. Governments also had to fight the misinformation spread online about COVID and its severity. Medical institutions eventually used intelligent data visualizations to show the public how bad the situation was. They used spline charts to show data about infections and what we had to reduce them.
Spline charts consist of curves generated from individual data points. They give a general sense of the trends the data has followed. By showing COVID data as curves, officials were able to make the public understand if the number of infections were climbing or falling. Eventually, the media introduced the term “flatten the curve” to show the people that even if infection peaks came, the curve overall was more significant.
How Does FusionCharts Make It Easy To Make & Share Charts?
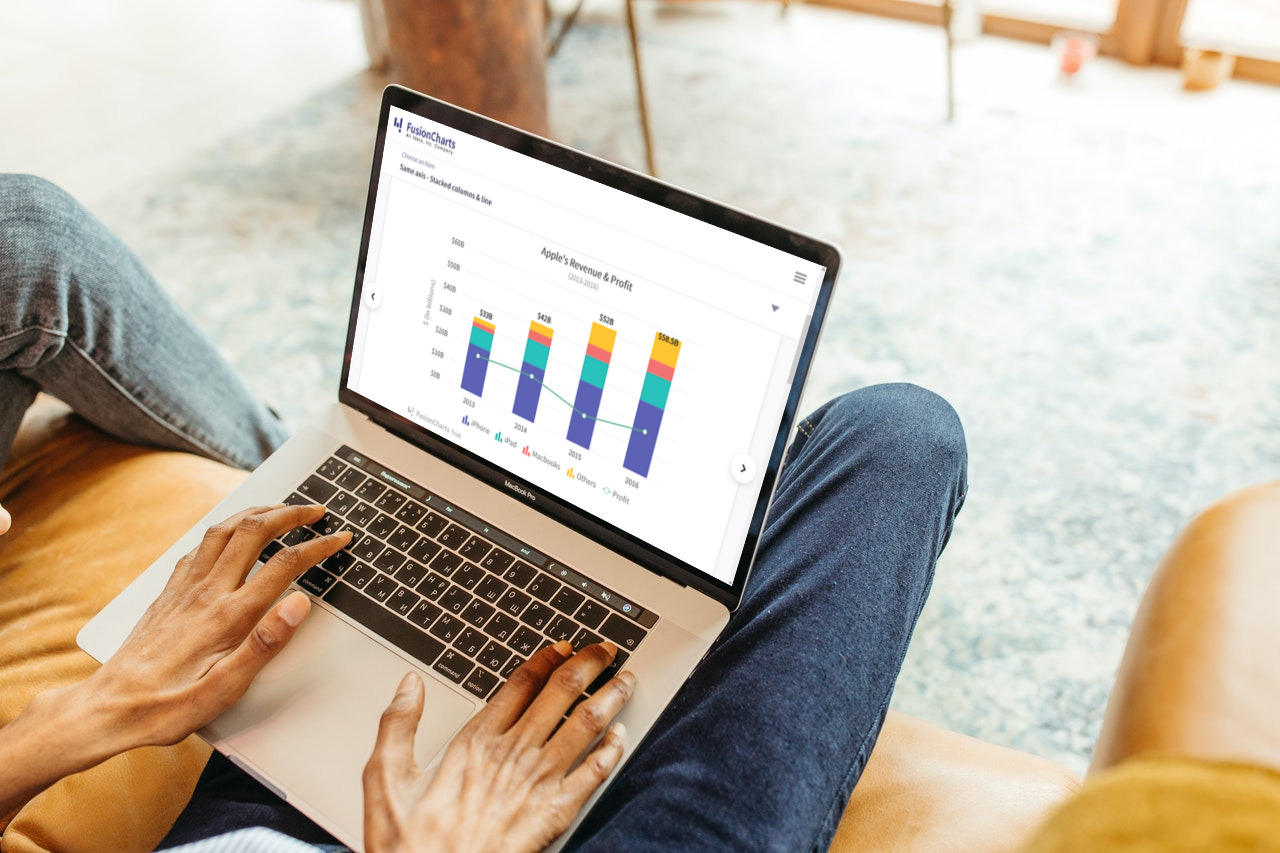
Intelligent data visualizations can sway opinions and share incredible insights with entire populations. FusionCharts can help you effectively use data visualization to get your ideas across through the internet without hassle. It is a powerful JavaScript data graphing and visualization library. That means you can easily embed it into your website’s code and start displaying powerful and interactive visualizations.
The main advantage of FusionCharts comes with the vast options of graphs and charts it offers. You can make robust dashboards featuring diverse kinds of visualizations and make them update dynamically as well. Additionally, you can facilitate the user to personalize the visualization and interact with it to control what they see.
Ready to take your data visualization skills to a whole new level? Head over to FusionCharts to ensure that your data insights don’t go unheard.