FEATURED IMAGE
Celebrating Eleven Years of Innovation at FusionCharts
If you have been following us over the years, you know that the we allow ourselves a little nostalgia on our birthday. At the breakneck speed the tech world operates at, it in fact is the only time we get to look back and reminisce the year gone by and all the things that happened. And as we turn eleven, we would like to take you down memory lane and share with you everything that happened over the last year. Stay with us, as we have a little something for you at the end.
- 21st September 2013: We launched JSWarrior at JSFoo 2013, a game where do not control your character through your keyboard or joystick. Instead, you write JavaScript code. Initially meant only for an event, we decided to keep it open since people were loving it so much.
- 21st September: We also launched RedRaphael at JSFoo 2013, an open-source JavaScript graphics library on steroids.
- 23rd August: After a relationship that lasted over a decade, we announced our final goodbye to Flash. We had been developing on both the Flash and JavaScript (HTML5) versions of our charts simultaneously for three years but it was time to break through the shackles and innovate faster. And with all our focus only on the JavaScript version of our charts, you bet we will.
- 17th August: Aurora R&D, our partners, released JSF plugins for FusionCharts. Everything set up in just a couple of minutes.
- 15th August: Featured as India’s hottest tech product on Live Mint. Been there, heard that but a little reaffirming doesn’t hurt 🙂
- 30th July: Our partners, Xpand IT released a new version of the FusionCharts Plugin for Pentaho with real-time charts and more.
- 28th June: Completed 2 years of operations in our Bangalore office. Feels like it was only yesterday we set up shop in the garden city.
- 30th May: SD Times, a leading magazine for software developers, picked us as a SD Times 100 winner for our delightful user experience. We are only going to take it further.
- 24th May: Got to know that the makers of SIRI use our products. We jumped in joy. And while we are name-dropping, did you know Barack Obama uses FusionCharts?
- 21st May: Released a comprehensive comparison of JavaScript charting libraries in the market to make it easier for users to find the best charting library for their needs. Turns out competitors started keeping a close watch on it and sending us changes every time they had a new version out.
- 17th April: Got called the bootstrapped startup pride of India by YourStory, one of India’s most comprehensive platforms for startups. Also they made a video of our workplace, check it out if you would like to see our Bangalore office and meet some of the people.
- 21st Feb: Hosted some of the brightest minds from the Valley as Geeks on a Plane decided to visit us.
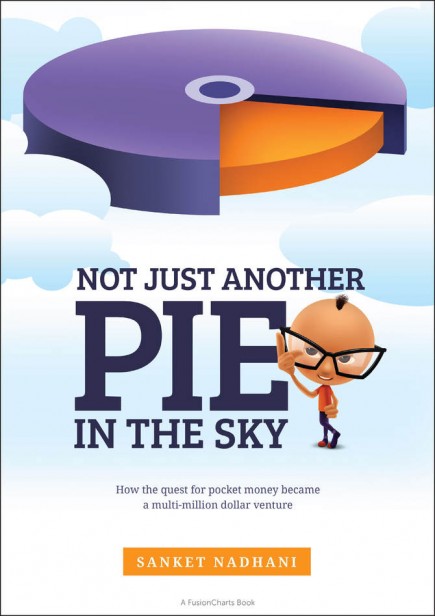
- 22nd October, 2012: Completed a decade of being in business and we released a book on our entire journey called Not Just Another Pie In The Sky. Over 10,000 people read the book in the course of a year and wrote in saying it was fun, inspiring and even cute.
A little something for you
On our eleventh birthday, we thought why not share the cuteness further? Going forward, Not Just Another Pie In The Sky is free for one and all to download and enjoy. So go ahead get your copy and let us know how you like it.