Choosing the best React chart library depends on what you are building. A simple project may need only basic bar and line charts. But a SaaS dashboard, analytics platform, or financial application may require interactivity, real-time updates, export options, and advanced customization.
In this guide, we compare the top React chart libraries for 2026 and explain which option best fits each use case.
Table of Contents
React Chart Libraries at a Glance
If you’re looking for the best React chart library in 2026, the right choice depends on your project requirements.
| Use Case | Recommended Library |
|---|---|
| Enterprise dashboards | FusionCharts |
| Open-source dashboards | Recharts |
| Real-time analytics | Apache ECharts |
| Highly customized visualizations | D3.js |
| Beautiful charts with minimal setup | Nivo |
| Design-system integration | Visx |
| Lightweight projects | Chart.js |
Key Takeaways
- React chart libraries simplify data visualization by providing reusable chart components.
- Recharts remains one of the most popular open-source options for React applications.
- Apache ECharts excels for large datasets and real-time dashboards.
- D3.js offers unmatched flexibility but requires more development effort.
- FusionCharts provides 100+ chart types, built-in interactivity, and enterprise-ready features.
- The best React chart library depends on your requirements for customization, performance, and scalability.
What Is a React Chart Library?
A React chart library is a collection of reusable components that helps developers create charts, graphs, and interactive data visualizations in React applications.
Instead of building charts from scratch using SVG, Canvas, or low-level visualization tools, React chart libraries provide ready-made components for common chart types such as:
- Bar charts
- Line charts
- Pie charts
- Area charts
- Scatter plots
- Heatmaps
- Financial charts
- Real-time dashboards
These libraries help developers build responsive, interactive, and visually appealing data visualizations while reducing development time.
Why Use a React Chart Library?
Building charts from scratch can be time-consuming and difficult to maintain. React chart libraries offer several advantages:
Faster Development
Pre-built chart components allow developers to create dashboards, reports, and analytics applications much faster than building visualizations from scratch. Most React chart libraries include common chart types, styling options, and interactivity out of the box, reducing development time and effort.
Interactive Visualizations
Modern React chart libraries provide interactive features that help users explore and understand data more effectively. Common capabilities include:
- Tooltips
- Zooming
- Panning
- Drill-down functionality
- Data filtering
These features make charts more engaging and useful for dashboards, reporting tools, and business applications.
Learn more about creating interactive React charts.
Responsive Design
Modern chart libraries automatically adapt to different screen sizes and devices. This ensures charts remain readable and functional on desktops, tablets, and smartphones without requiring significant additional development work.
Better Performance
Many React chart libraries are optimized to render large datasets efficiently while maintaining a smooth user experience. Some libraries also support techniques such as Canvas rendering, data aggregation, and real-time updates to improve performance in data-intensive applications.
Easier Maintenance
Reusable React components simplify updates and long-term maintenance. Developers can standardize chart implementations across projects, making it easier to update styles, add new features, and ensure consistency throughout an application.
Wide Range of Chart Types
Most React chart libraries support a variety of visualization types, including bar charts, line charts, pie charts, scatter plots, heatmaps, and financial charts. This flexibility allows developers to choose the most effective way to present different types of data without switching between multiple libraries.
How We Evaluated These React Chart Libraries
To identify the best React chart libraries in 2026, we evaluated each option based on:
- Ease of use
- Number of chart types
- Performance
- Customization options
- TypeScript support
- Documentation quality
- React compatibility
- Real-time data support
- Dashboard capabilities
- Licensing and pricing
The 7 Best React Chart Libraries in 2026
Choosing the right React chart library depends on your application’s goals, data complexity, and user experience requirements. Some projects only need simple bar, line, or pie charts, while others require real-time updates, drill-downs, financial charts, maps, dashboards, or advanced customization.
Below, we compare seven of the best React chart libraries in 2026 to help you choose the right option for your project.
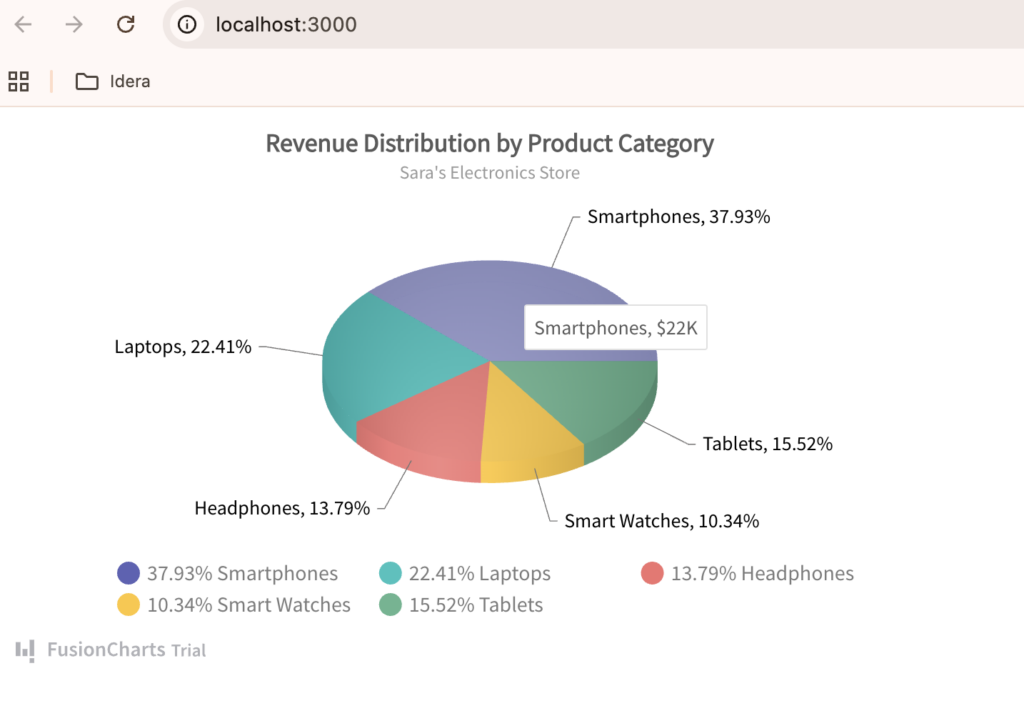
1. FusionCharts
Best for: Enterprise dashboards and business applications
FusionCharts is a feature-rich JavaScript charting library with React integration, supporting over 100 chart types and 2,000+ maps.
It is particularly well-suited for analytics platforms, business intelligence applications, financial dashboards, and enterprise reporting systems.
Pros
- 100+ chart types
- Interactive dashboards
- Real-time updates
- Drill-down capabilities
- Exporting and reporting features
- Extensive documentation
Cons
- Commercial license required
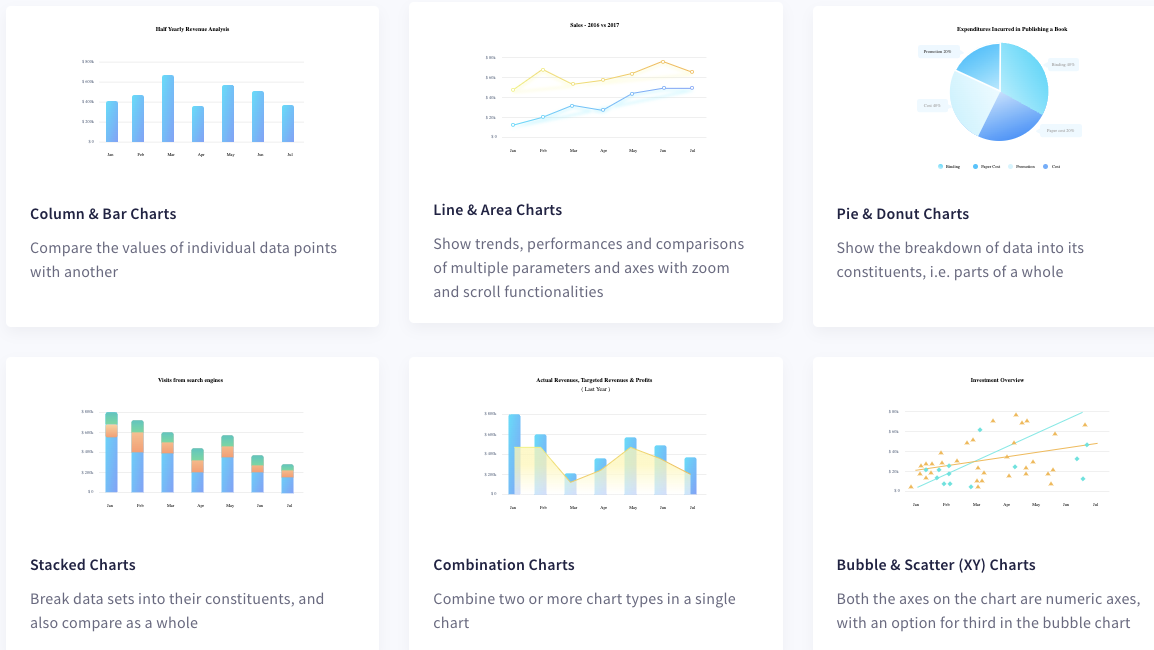
Popular Chart Types
- Column and bar charts
- Line and area charts
- Pie and donut charts
- Scatter and bubble charts
- Stacked charts
- Combination charts
- Funnel and pyramid charts
- Gantt charts
- Heatmaps
- Maps and geospatial visualizations
- Real-time charts
- Financial and stock charts
- Gauges and KPI widgets
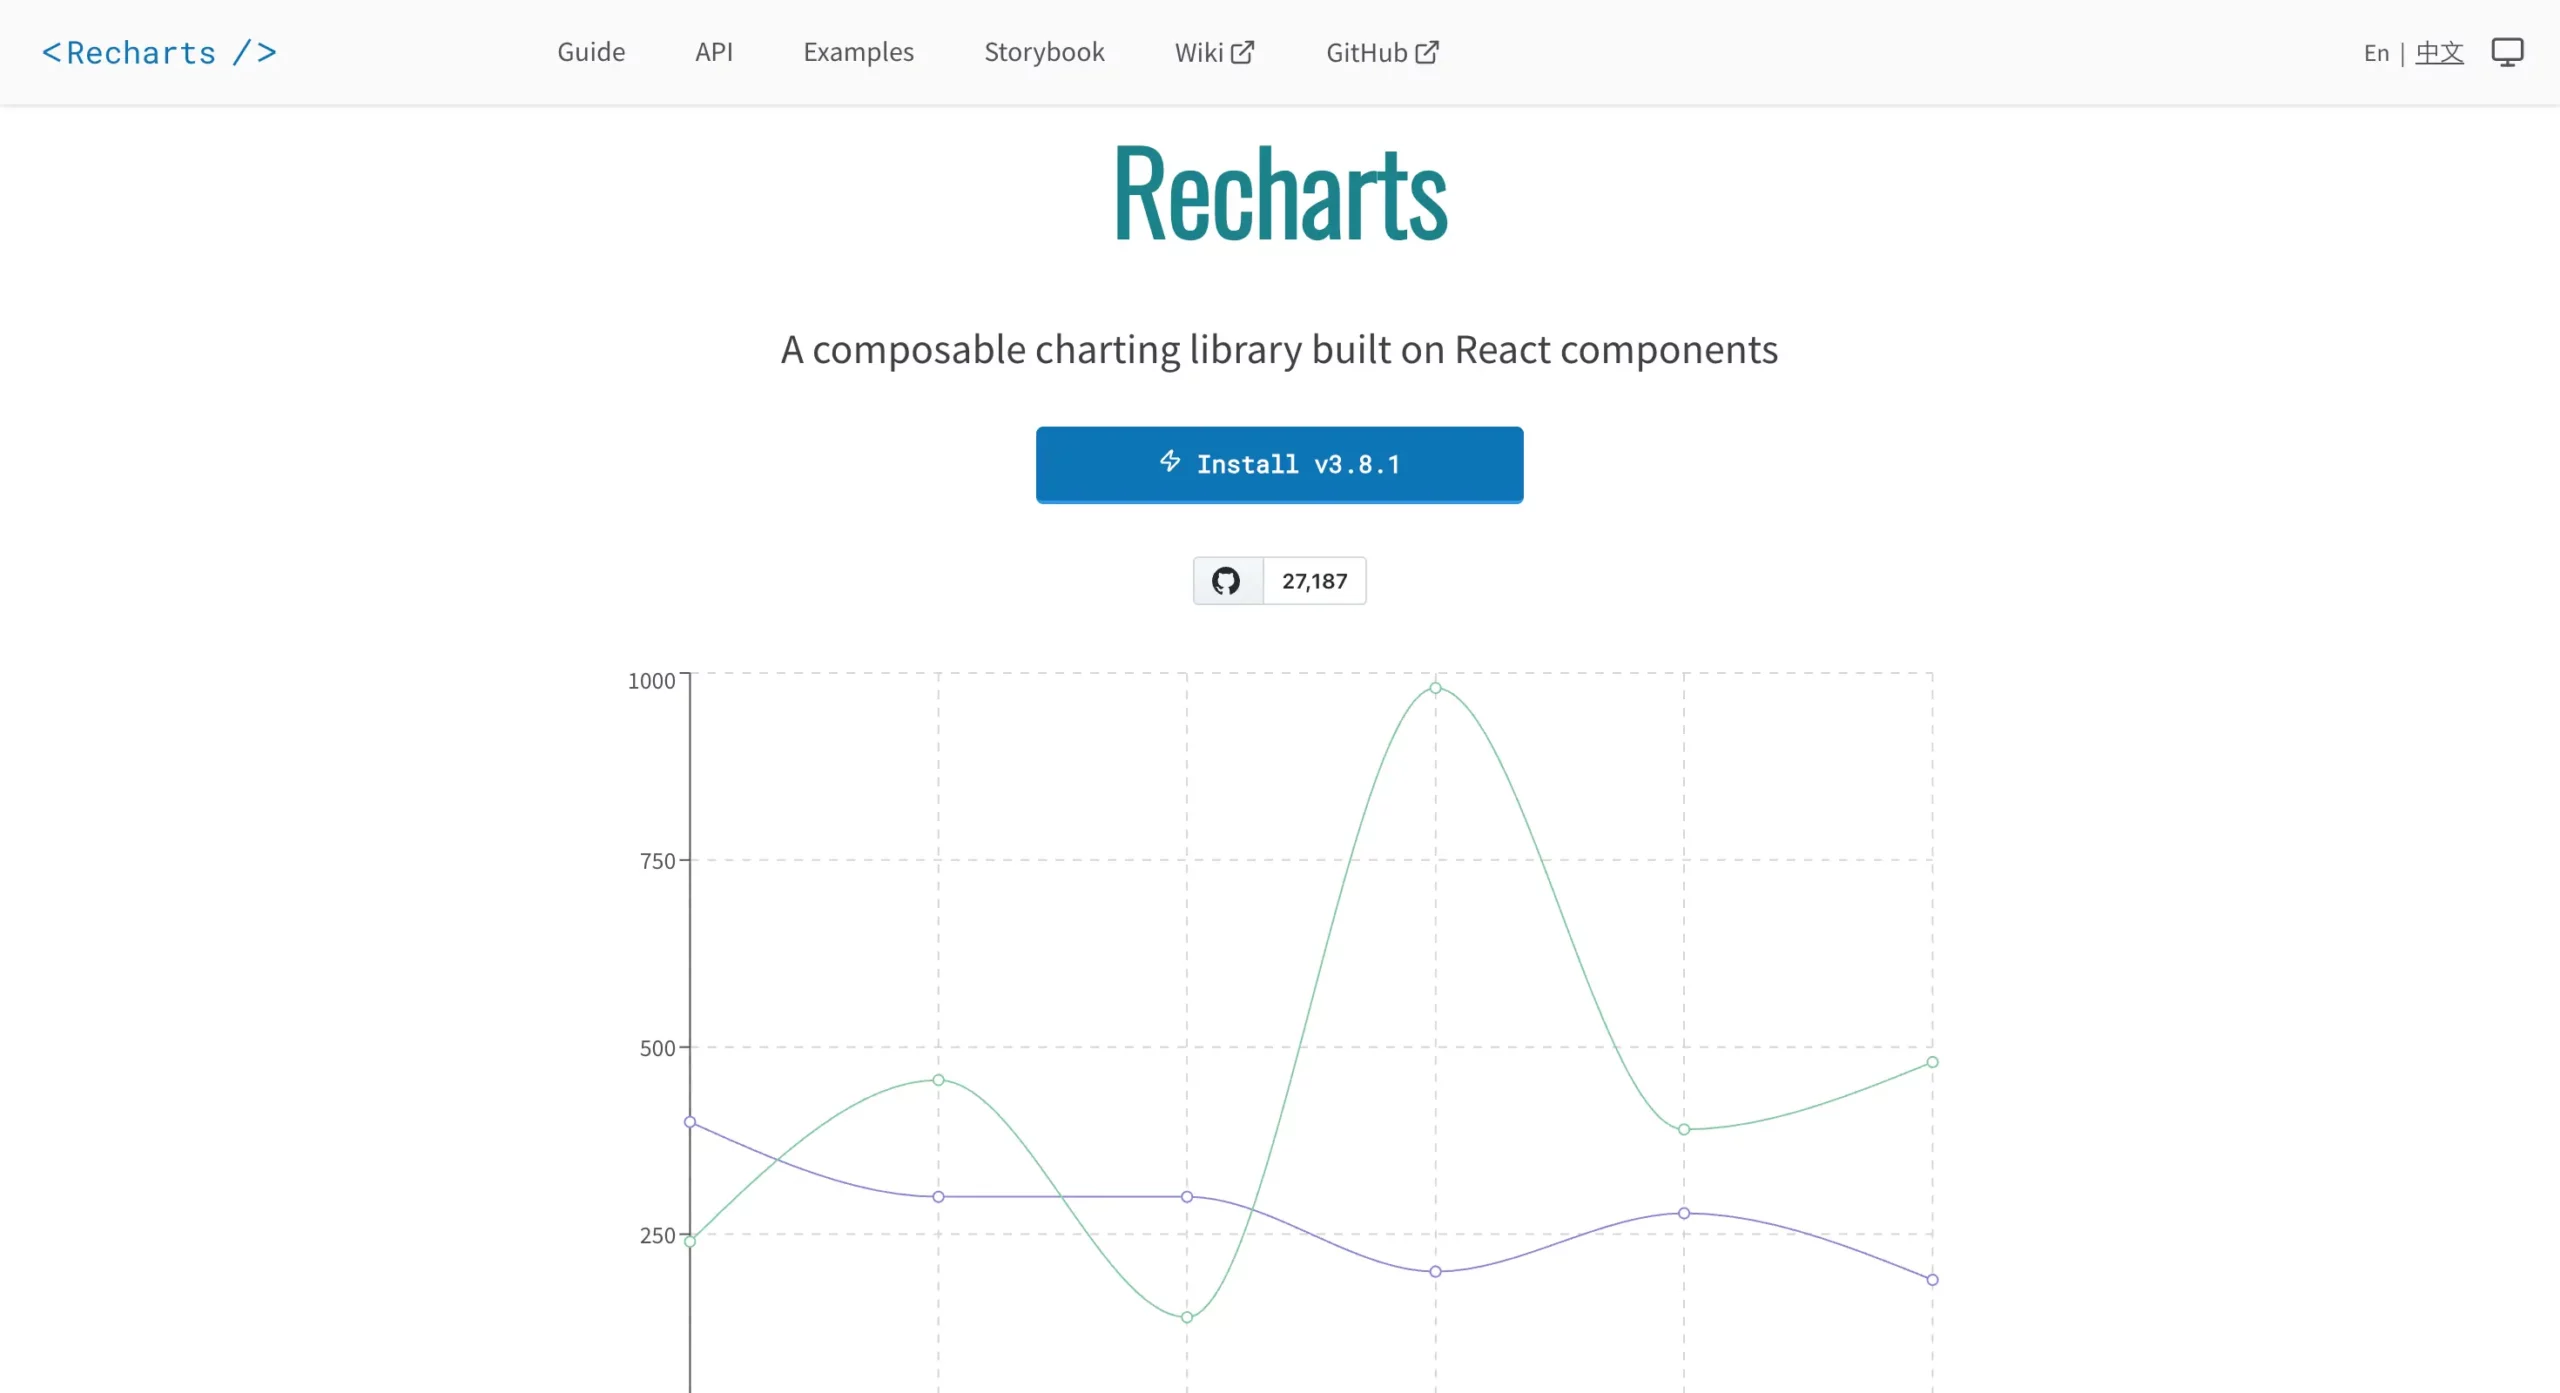
2. Recharts
Best for: Open-source React applications
Recharts is one of the most widely used React chart libraries. Built specifically for React and powered by SVG, it provides a clean API and strong community support.
Pros
- Easy to learn
- React-native architecture
- Strong community adoption
- Good documentation
Cons
- Limited advanced chart types
- May struggle with extremely large datasets
Popular Chart Types
- Line charts
- Area charts
- Bar charts
- Pie charts
- Scatter charts
- Radar charts
- Radial bar charts
- Treemaps
- Composed charts
- Funnel charts
- Sankey charts
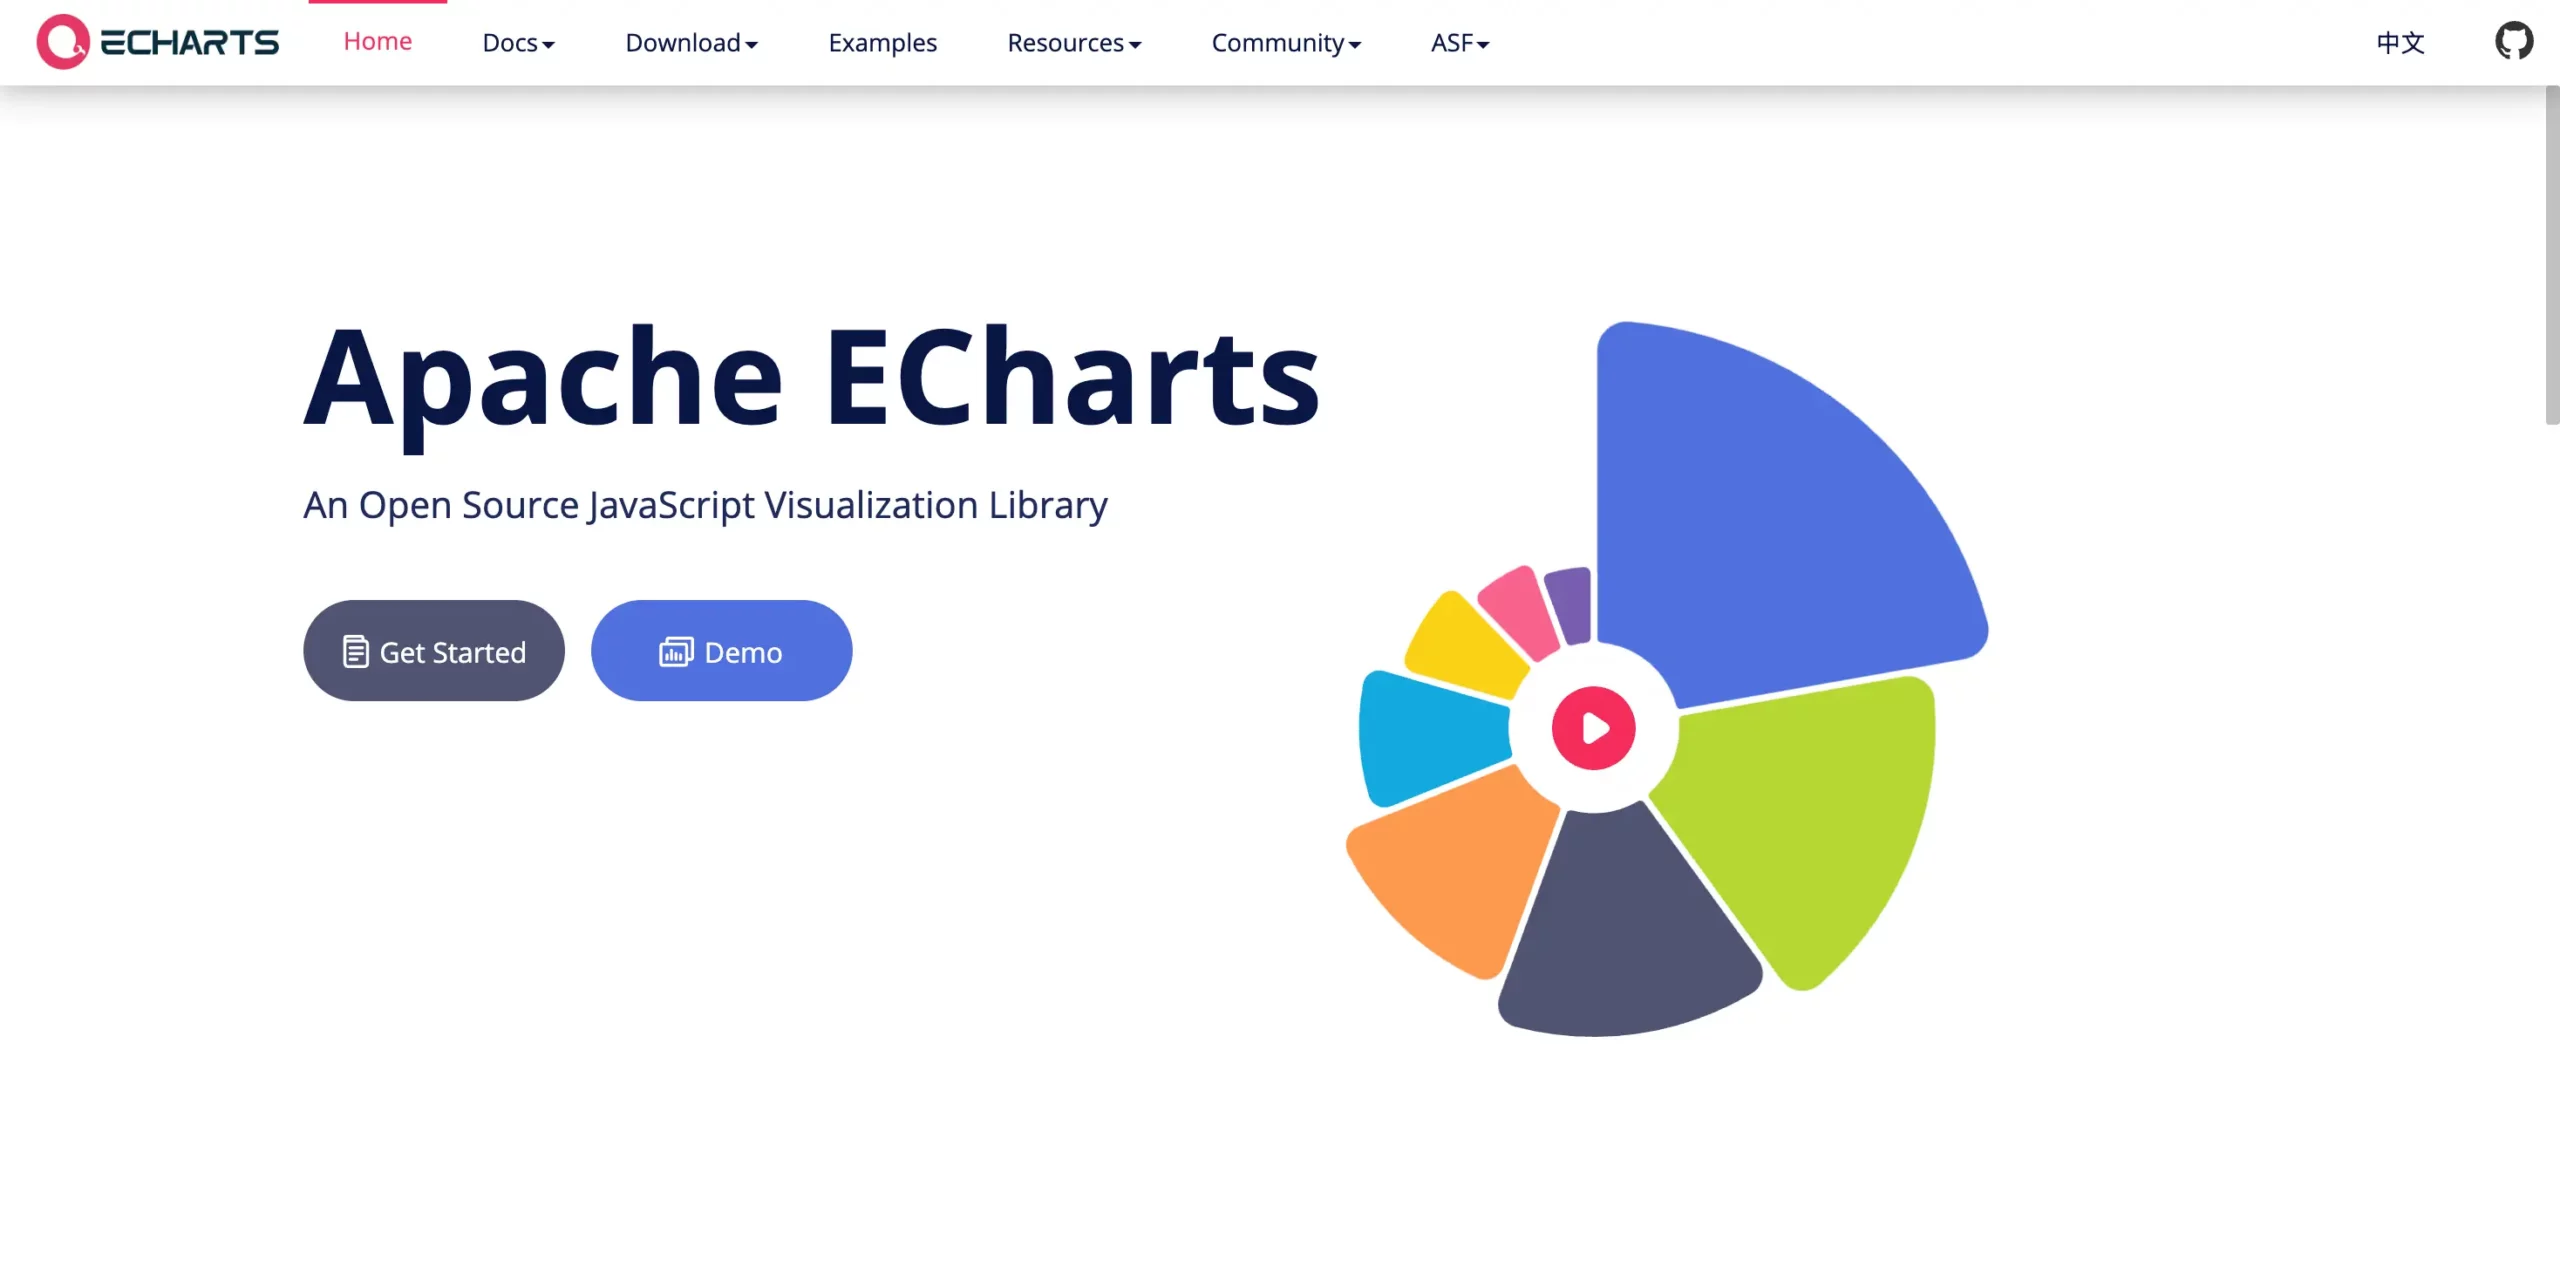
3. Apache ECharts
Best for: Real-time analytics and large datasets
Apache ECharts offers powerful visualization capabilities and excellent performance.
It supports advanced chart types, geographic visualizations, and real-time data applications.
Pros
- Excellent performance
- Advanced visualizations
- Real-time capabilities
- Large dataset support
Cons
- Steeper learning curve
Popular Chart Types
- Line charts
- Bar and column charts
- Pie and donut charts
- Scatter plots
- Heatmaps
- Radar charts
- Treemaps
- Sankey diagrams
- Candlestick and financial charts
- Funnel charts
- Gauge charts
- Geographic maps
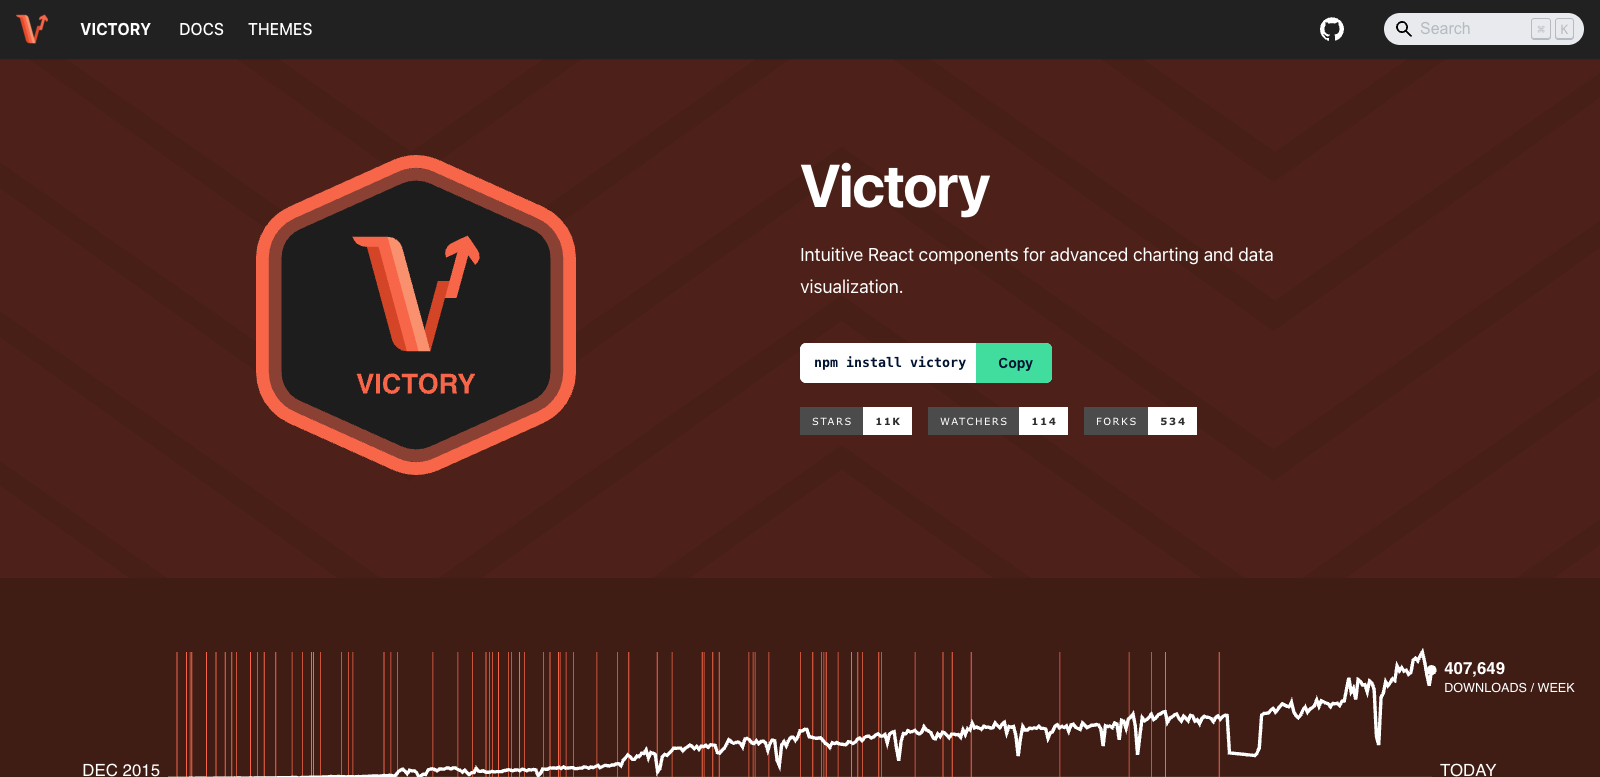
4. Victory
Best for: Cross-platform React and React Native applications
Victory is an open-source charting library designed specifically for React and React Native. It provides a consistent API across web and mobile platforms, making it a popular choice for teams building data-driven applications that need to run on multiple devices.
Pros
- Works with both React and React Native
- Consistent and intuitive API
- Good customization capabilities
- Built-in animations and interactivity
- Comprehensive documentation
- Open source
Cons
- Smaller community compared to Recharts and Chart.js
- Can require more configuration for complex visualizations
- Limited advanced chart types compared to some alternatives
Popular Chart Types
- Bar charts
- Line charts
- Area charts
- Pie charts
- Scatter plots
- Candlestick charts
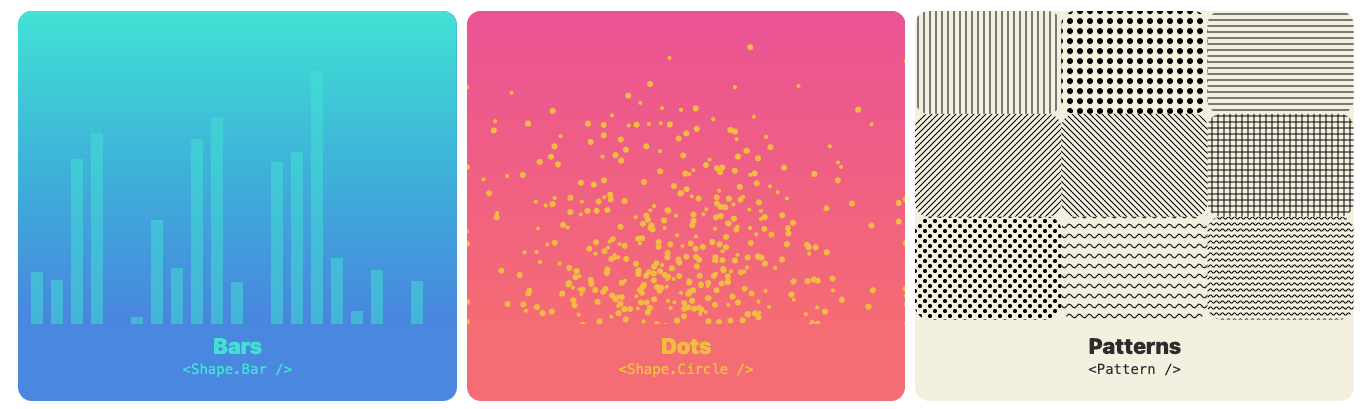
5. Visx
Best for: Design systems and custom UI
Visx is a collection of low-level visualization components developed by Airbnb that combines the power of D3.js with React. Rather than providing fully built charts, Visx gives developers the building blocks needed to create highly customized data visualizations while maintaining React’s component-based architecture.
Pros
- Highly flexible and customizable
- Excellent for design systems
- Modular architecture
- Leverages D3’s visualization capabilities
- Integrates naturally with React
Cons
- Requires more implementation effort
- Steeper learning curve than Recharts or Chart.js
- Fewer out-of-the-box chart components
Popular Chart Types
- Line charts
- Bar charts
- Area charts
- Pie charts
- Scatter plots
- Heatmaps
- Treemaps
- Custom visualizations
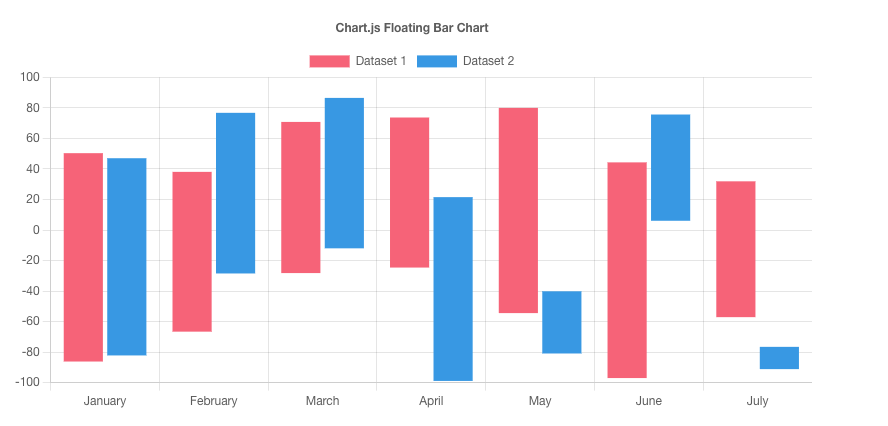
6. Chart.js (via react-chartjs-2)
Best for: Simple projects and quick implementation
Chart.js is one of the most popular JavaScript charting libraries and is known for its simplicity and ease of use. React developers typically use it through the react-chartjs-2 wrapper, which provides React-friendly components while retaining the functionality of the underlying Chart.js library.
Its straightforward API and extensive documentation make it an excellent choice for developers who need to create charts quickly without spending significant time on configuration.
Pros
- Easy setup and implementation
- Lightweight and performant
- Strong documentation and community support
- Responsive by default
- Good selection of standard chart types
Cons
- Less customizable than D3.js or Visx
- Limited advanced visualization options
- Not ideal for highly complex dashboards
Popular Chart Types
- Line charts
- Bar charts
- Pie charts
- Doughnut charts
- Radar charts
- Polar area charts
- Bubble charts
- Scatter plots
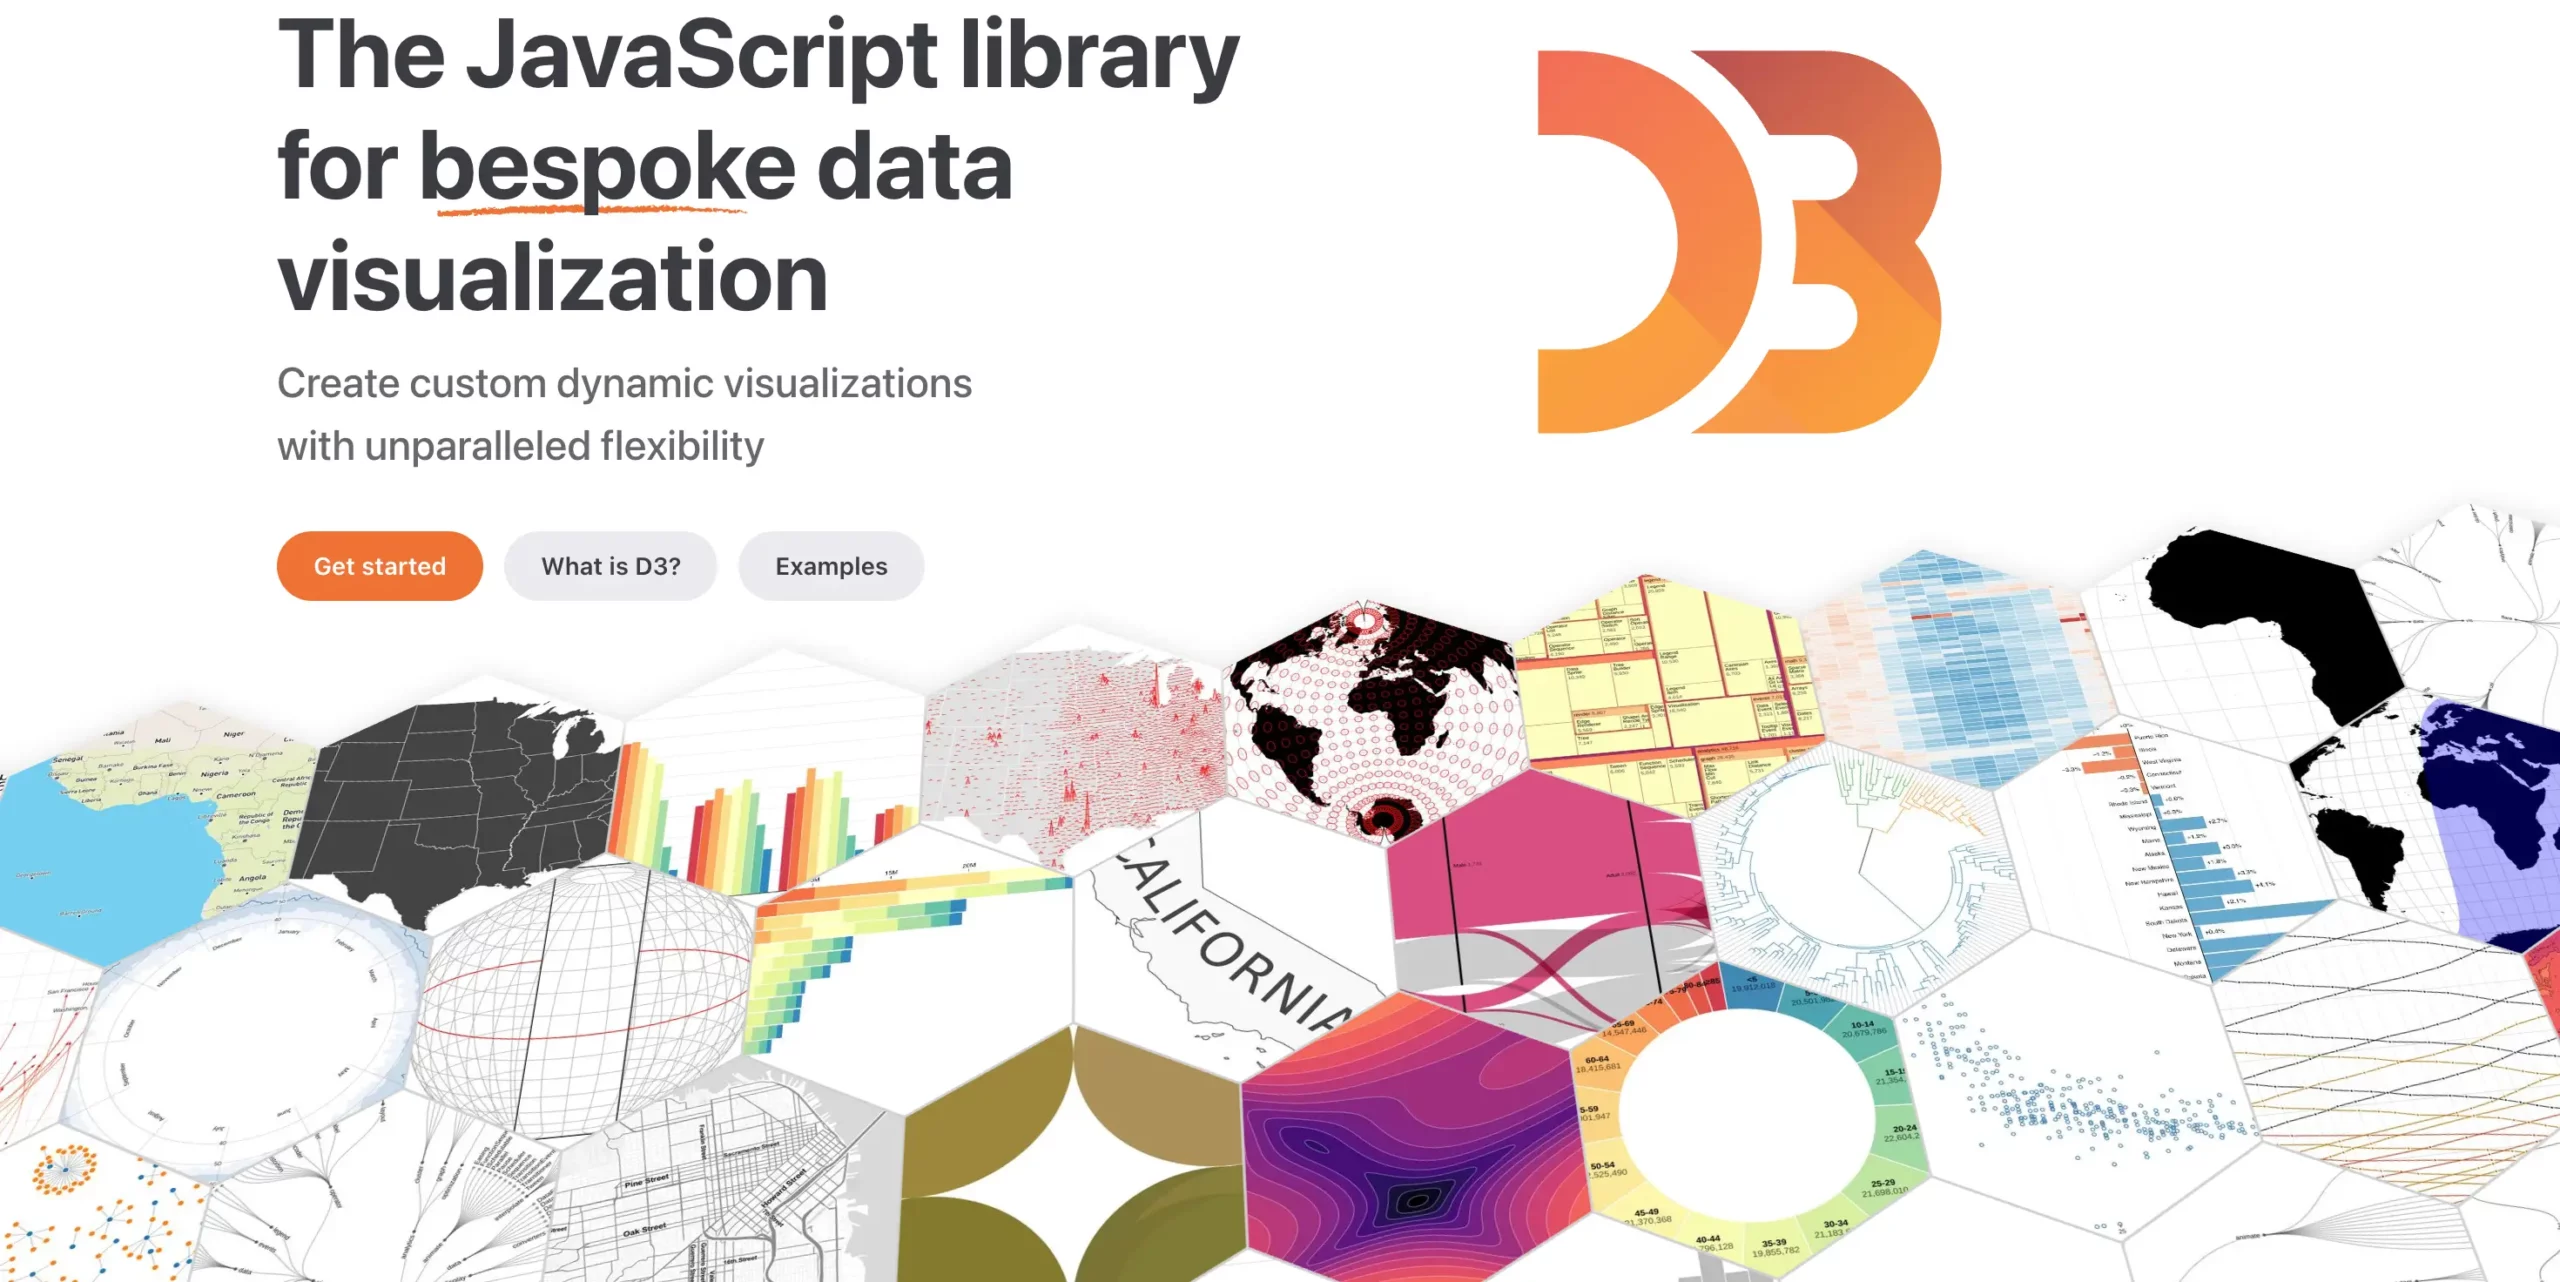
7. D3.js
Best for: Advanced custom visualizations
D3.js (Data-Driven Documents) is one of the most powerful data visualization libraries available. Unlike most chart libraries, D3.js provides low-level control over SVG, Canvas, and HTML elements, enabling developers to build virtually any type of data visualization imaginable.
While D3.js requires more development effort than React-focused chart libraries, it offers unmatched flexibility and is often the foundation for many modern visualization tools.
Pros
- Unlimited flexibility
- Highly customizable
- Industry standard for advanced visualizations
- Supports SVG, Canvas, and HTML rendering
- Massive ecosystem and community
Cons
- Steep learning curve
- Longer development time
- Requires more code than higher-level chart libraries
Popular Chart Types
- Line charts
- Bar charts
- Area charts
- Scatter plots
- Heatmaps
- Treemaps
- Sankey diagrams
- Chord diagrams
- Geographic maps
- Custom interactive visualizations
React Chart Library Comparison
With several excellent React chart libraries available, choosing the right one can be challenging. The table below compares the most important factors, including chart variety, real-time capabilities, licensing, and ideal use cases, to help you quickly identify the best fit for your project.
| Library | Open Source | Chart Types | Real-Time Support | Best For |
|---|---|---|---|---|
| FusionCharts | No | 100+ | Yes | Enterprise dashboards |
| Recharts | Yes | Moderate | Limited | React applications |
| Apache ECharts | Yes | Extensive | Yes | Analytics platforms |
| Nivo | Yes | Extensive | Limited | SaaS dashboards |
| Visx | Yes | Custom | Depends on implementation | Design systems |
| Chart.js | Yes | Moderate | Basic | Small projects |
| D3.js | Yes | Unlimited | Depends on implementation | Advanced visualizations |
What to Look for in a React Chart Library in 2026
Before choosing a library, consider:
React and TypeScript Support
Look for active maintenance and strong TypeScript support.
Dev Community
You should refer to the dev community to choose the best chart library. You’ll find people who might be working on a similar project or the same technologies. Hence, you can discuss or weigh out your options.
Built With
You must ensure your library works seamlessly with all the technology stacks you use.
Next.js Compatibility
If you’re building modern React applications, SSR and Next.js support can be important.
Performance
Large datasets require optimized rendering and efficient updates.
Drawing Support
Your library must have drawing support if that’s what your app requires. You have to make these decisions in advance while choosing the library you want to go with.
Client Side/Server Side
You must choose a charting library that aligns with your end goal, and client side/server side is something worth considering when choosing the library you want to go with.
Animation
When considering a library, you should first see if you’re going to do animation work or not. If so, choose a library with the best animation packages that will be useful to you in your project.
Responsive
Another concern when choosing a library is its responsiveness. Let’s say you want real-time charts that update with time. You need to make sure you use chart libraries that allow you to achieve this smoothly and with fluency.
Flexibility
Your library must be flexible to your needs. You must ensure that whatever you want to do in your app, the library must provide enough headway to make changes as the project continues.
Accessibility
Ensure charts remain usable for all users.
Real-Time Data Support
Applications such as monitoring dashboards and analytics tools often require live updates.
Customization
Choose a library that provides the level of flexibility your project requires.
If you want to play with different charting libraries and make your own radar charts or a bar chart, you should try building your own React chart library.
Final Thoughts
React chart libraries make it easier to build dashboards, reports, and interactive data visualizations.
The best choice depends on your project goals, performance requirements, and customization needs. While open-source libraries such as Recharts and Apache ECharts are excellent options, organizations building advanced analytics and enterprise dashboards often benefit from feature-rich solutions such as FusionCharts.
Explore FusionCharts to create interactive React charts with minimal development effort.
Let’s check out FusionCharts for react today!
FAQs
What is the best React chart library?
The best React chart library depends on your requirements. FusionCharts is a strong choice for enterprise dashboards, while Recharts remains one of the most popular open-source options.
Which React chart library is easiest to use?
Recharts and Chart.js are generally considered the easiest React chart libraries for beginners.
What is the best React chart library for dashboards?
FusionCharts, Recharts, Apache ECharts, and Nivo are commonly used for dashboard applications.
Which React chart library supports real-time data?
Apache ECharts and FusionCharts offer strong support for real-time data visualization.
Are there free React chart libraries?
Yes. Recharts, Apache ECharts, Nivo, Visx, Chart.js, and D3.js are all available as open-source solutions.
Does React include built-in chart components?
No. React does not include built-in chart components, so developers typically use third-party chart libraries.