
Table of Contents
Introduction
According to statistics [1], humans produce about 2.5 quintillion bytes of data daily. And businesses today look to leverage this data to keep up with constantly evolving consumer expectations. This involves quickly understanding complex data and making data-driven decisions. However, we are visual creatures. Data, in itself, is not visually appealing and, therefore, can be difficult to understand. But what if it wasn’t? React chart libraries let you quickly represent complex data in a visually compelling manner that’s easy to understand. Thereby enabling faster decision-making processes, which is imperative for survival in our fast-paced world. However, the React chart library market is over-saturated, and finding the best fit for your project can be overwhelming. That’s why we’ve created this list of high-quality chart libraries to inform your research.What is a React Chart Library?
A React Chart Library is a collection of tools, components, and functions designed to create charts/graphs within React applications. React, a popular UI library offers a react chart library for crafting interactive and visually appealing charts in web applications. These libraries provide pre-built components and functionalities for creating charts like lines, bars, pies, scatter plots, etc. They typically offer features like interactivity, customization options, performance optimization, and accessibility enhancements. React Chart Libraries streamline the process of building data visualizations in React applications, allowing developers to focus on creating compelling user experiences.Most popular React Chart Libraries in 2024
React’s diverse ecosystem extends to data visualization with its robust chart libraries. These libraries empower developers to effortlessly integrate interactive and visually stunning charts into their web applications, enhancing user experience and data comprehension. Here are a few best react chart library options that you can choose from:FusionCharts
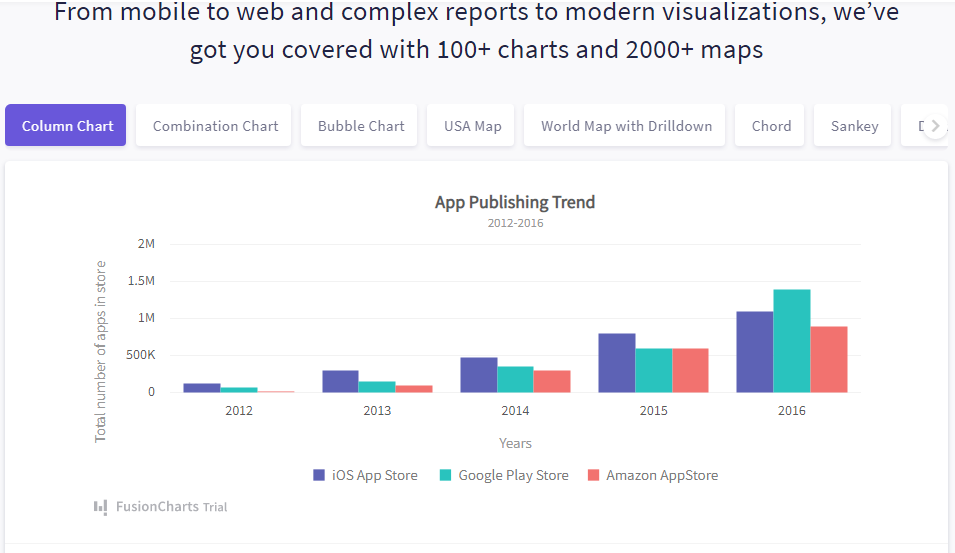
One of the most sophisticated yet easy-to-use React chart libraries is FusionCharts. Its React components empower you with all that’s needed to create responsive and interactive visualizations of your datasets. It also supports the integration of React charts with a Javascript grid. Some additional features include:- Supports integrations with a JavaScript grid for seamless chart-grid interactions.
- FusionCharts offers powerful time-series charts and easy dashboard export, with support for older browsers and responsive design.
- Supports for zooming, panning, animations, and drill-downs for enhanced data exploration.
- It provides real-time updates for dynamic data visualization needs.
- Fusioncharts offer full exporting of charts & dashboards for sharing and collaboration.
Ant Design React Chart Library
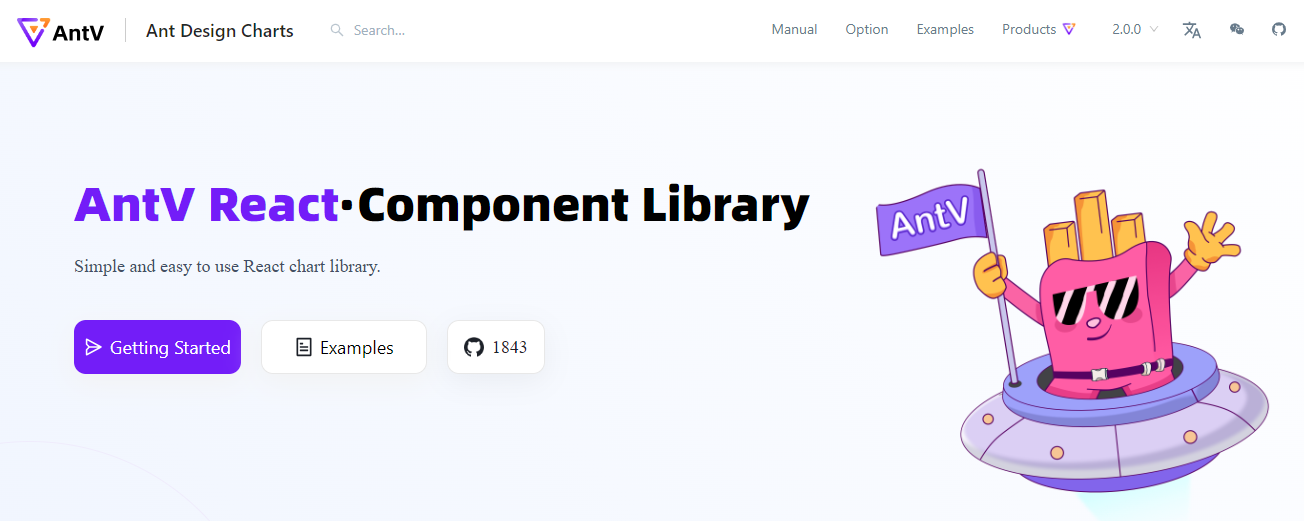
The next charting library on our list is Ant Design Charts. This library is more accessible to students of React charting stackSame team building. This library is designed to deliver high-quality development and user experience. Some of its features include:
- Customizability
- Ready to use default chart options
- Responsive charts
- Ease of implementation
BizCharts
 One of the most impressive React chart libraries is BizCharts. With a highly versatile template library, they currently boast one of the most extensive charts collections. Therefore, making it a great option for quickstart designing and data visualization projects. However, it is owned by an Asian company, and its documentation is in Chinese. Here are a few features of Bizcharts:
- Provides robust expandability
- Compatible with most data visualization charts
- Makes use of React es6 grammar
eCharts For React
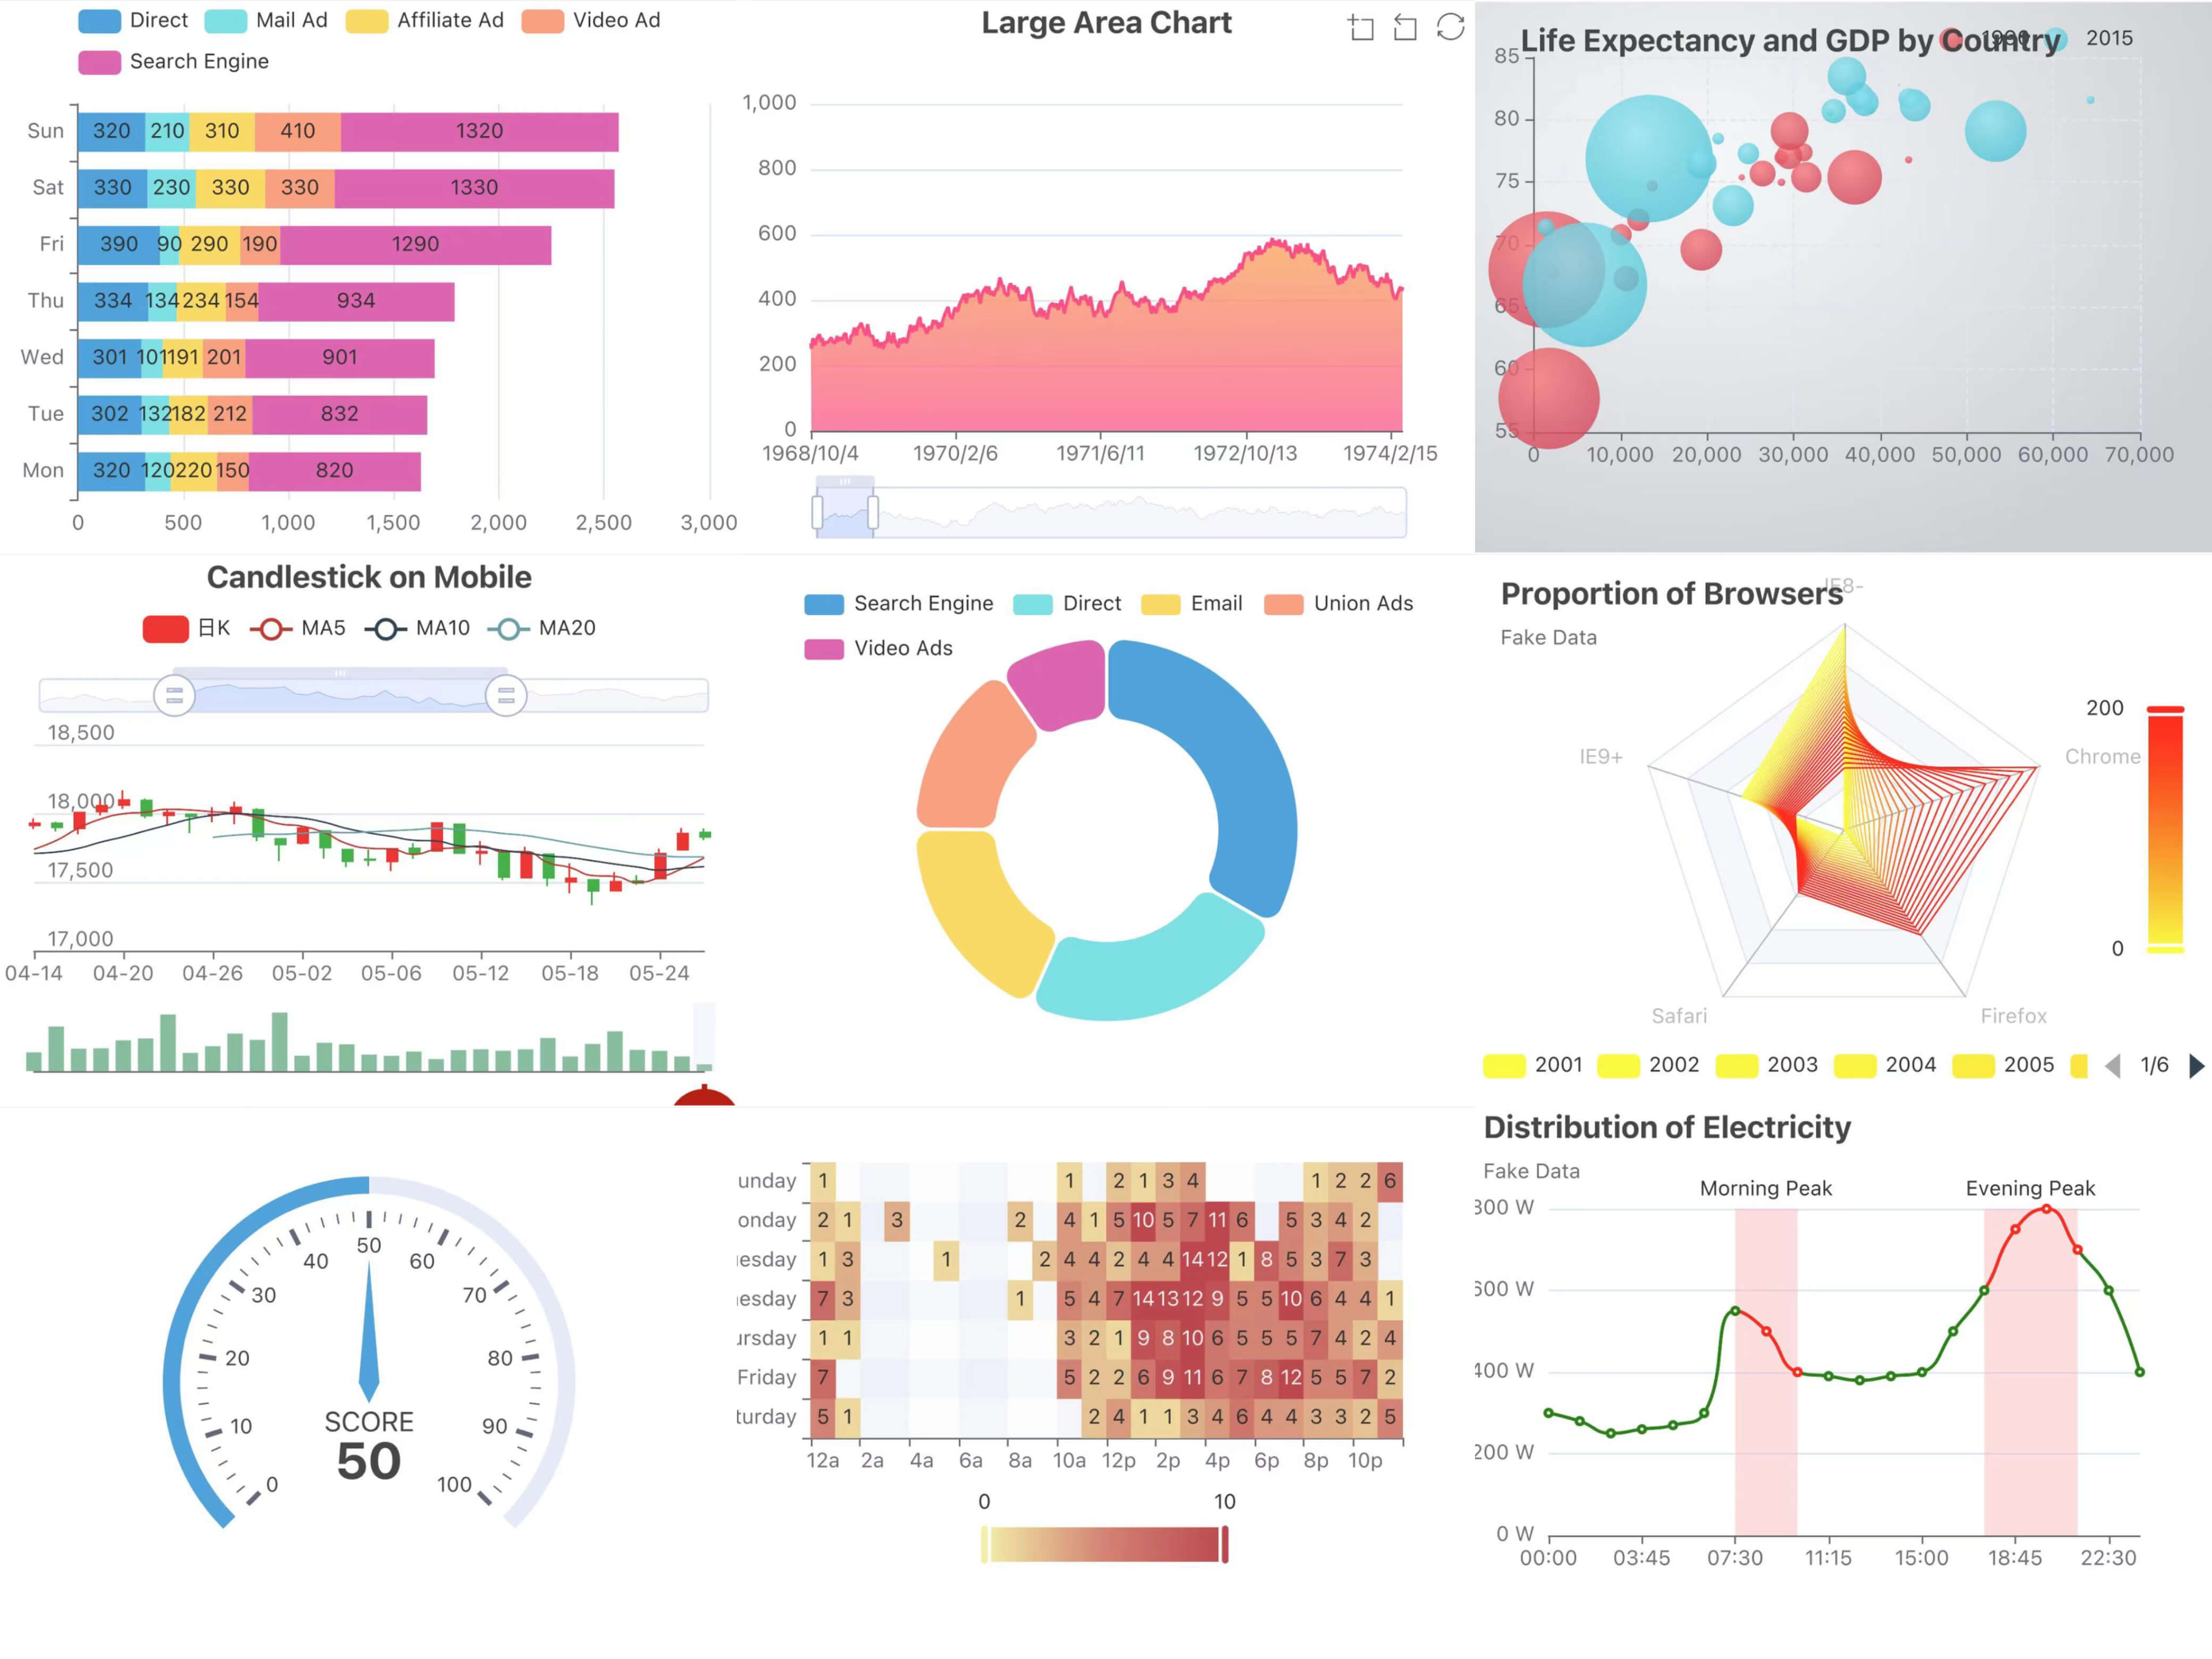 eCharts for React is a free charting mainly used to add charts to commercial products. Its configuration makes it easy for developers to quickly incorporate responsive and highly customizable charts in commercial solutions. eCharts for React features:
- ZRendering engine
- Canvas and SVG support
- Animations
- Accessibility features
- Interactive and responsive chart gallery
- Multi-rendering
Nivo React Chart Library
 This falls under the category of special React charting libraries. Nivo is a unique data visualization tool. Its server-side rendering support enables web developers to generate charts and server-side data. Its extensive chart template library offers different options for almost every graph and chart type. Nivo also offers flexible charting options with animation features. Some other features include:
- Customizability
- HTML support
- SVG support
Recharts
 Recharts is one of the oldest React-powered charting libraries. Its chart components are configured declaratively. It has a light dependency on a few D3 modules, while also providing native SVG support. Some of the features provided by Recharts are:
- Native SVIG compatible
- Is lightweight
- Uses simple API
- Well suited with SVG charts
React Chart JS 2
 If you’ve come across Chartjs at any point, you probably know that React-Chartjs-2 is not typically a React chart library. Rather, it is a React wrapper for Chartjs. In other words, this React solution lets you use Chartjs in your React projects. That said, Chartjs is a popular JavaScript charting library that leverages HTML 5 canvas elements to build intuitive visualizations. Some of its features include:
- Ease of implementation
- Animation
- Customizability
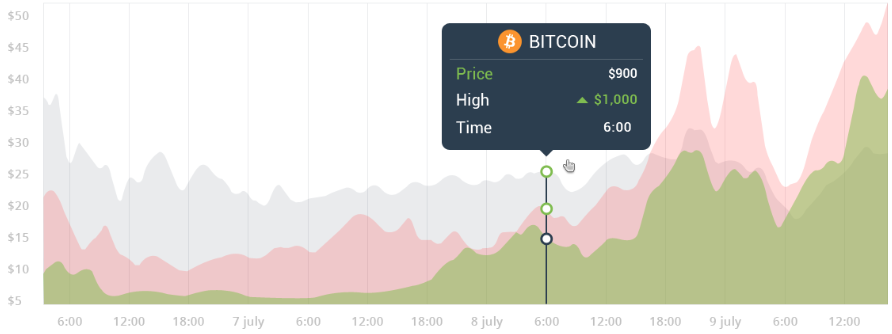
React Timeseries Charts
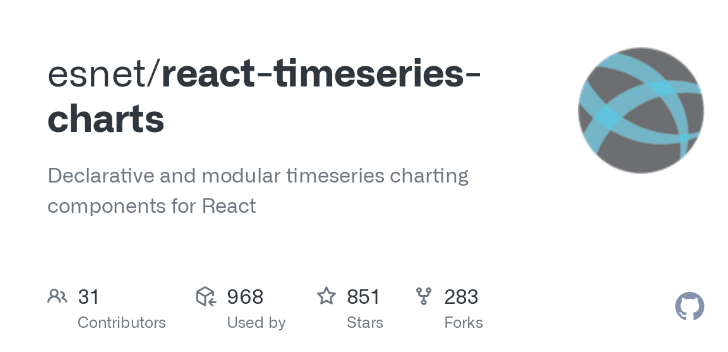 This is a chart library explicitly created for time series components. It boasts an extensive library of components configured to develop visualizations for time series data in react. While this react graphing library is not actively maintained with regular updates, its dynamic documentation makes it easy to use and keep up with changes. Some of its features include:
- Panning and zooming support
- Overlays support
- Multiple axes, multiple rows
- Declarative charts layout using JSX
- Legends
React Vis
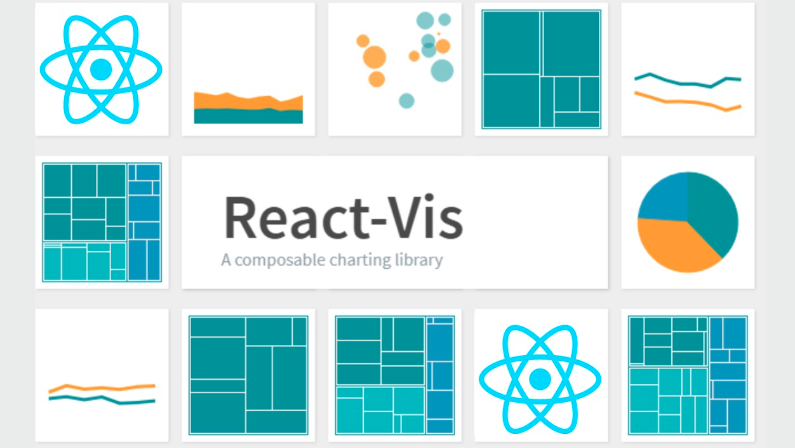 This is one of the most popular charting libraries from a unique source – the Uber Open Source web developers. Its configuration consists of React chart components for representing common data charts and graphs. The visualizations you can accomplish with React Vis include:
- Line/area/bar charts
- Heat maps
- Scatterplots
- Contour plots
- Hexagon heatmaps
- Pie and donut charts
- Sunbursts
- Radar charts
- Parallel coordinates
- Treemaps
- Ease of use
- Interactive charts
- React integrations
- Customizability
React StockCharts
 For web developers looking for a platform to look after their financial data visualization needs, React StockCharts is your one-stop shop. As the name implies, this chart library offers components for visualizing financial or stock data. Some of these components include 60 technical indicators and overlays. React StockCharts features:
- Pan and zoom support
- SVG support
- Customizable charts
- Customizable chart components
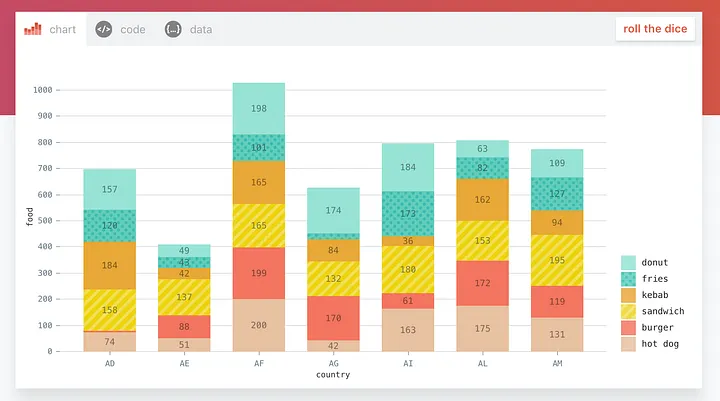
Rumble Charts
 Based on D3.js under the hood, Rumble Charts is a collection of reusable React components for visualizing large datasets. If you are looking for anonymous React charting libraries, then Rumble Charts is your go-to React chart library. It is a modest app with modern-day templates. Here is a list of features provided by rumble charts:
- Comes With in built functionality to use labels
- Easily composable
- Provides flexibility
- D3.js under the hood
Victory
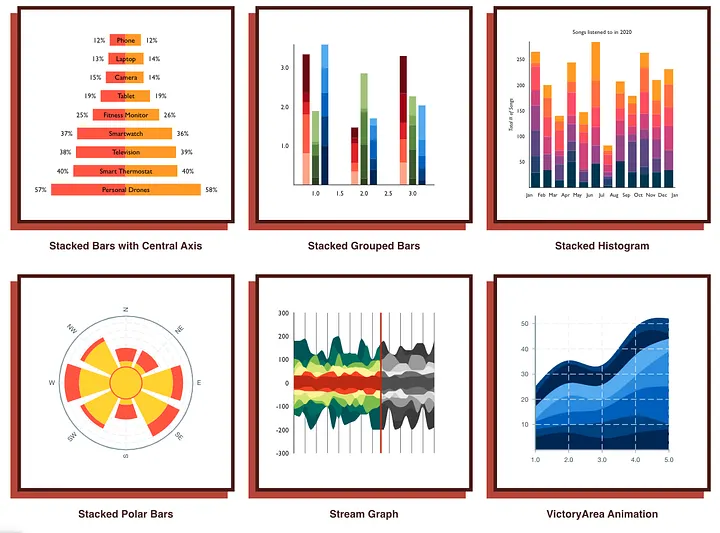 Developed by Formidable, the popular software development company, Victory is a renowned React charting library that supports both React and React Native. Its same API usage across Web and React Native applications drives its cross-platform capabilities. Like Rumble Charts, Victory can be described as a set of modular React components for quickly visualizing complex data. Charts and graphs you can quickly integrate using Victory are line charts, bar charts, pie charts, and candlestick charts. Some of its features include:
- Cross-platform charting
- Reusable data visualization elements
- Customizable charts
Visx
 Visx is an open-source data visualization tool. Like the previous two libraries, the creators of Visx describe it as a collection of low-level components for React data visualization. These components are split into 30 packages; each containing React visualization primitives. It combines React DOM and D3.js to create interactive visualizations with React benefits. Feature list of Visx includes:
- Uses D3 to perform calculations
- Comes with an option to create reusable chart components
- Low Level Graphical Components to create expressive charts
Tips for Choosing the Right React Chart Library
When selecting the ideal react graphing library, make sure to use these tips:- Nature of your project: Consider the specific requirements and goals of your project. Different chart libraries excel in different types of visualizations, so choose one that aligns with your project’s needs, whether it’s simple line charts or complex interactive dashboards.
- Design consistency: Look for a chart library with consistent styling options and a cohesive design language. This ensures that your charts blend seamlessly with your application’s overall look and feel, enhancing the user experience.
- Performance and scalability: Evaluate the performance and scalability of the react charting library, especially if you anticipate working with large datasets or require real-time updates. Choose a library that is optimized for rendering speed and can handle the volume of data your project requires.
- Integration and compatibility: Ensure the chart library integrates smoothly with your existing React ecosystem, including state management libraries, UI frameworks, and data sources. Compatibility with popular tools and frameworks will streamline development and maintenance.
- Learning curve and documentation: Consider the learning curve associated with the chart library and the availability of comprehensive documentation and resources. Opt for a library that offers clear documentation, tutorials, and community support to expedite the learning process and troubleshoot any issues that arise.
Conclusion
React chart libraries empower developers to create stunning and interactive data visualizations within their applications. This unlocks clear understanding and faster decisions through engaging visuals, ultimately enhancing user experiences. While the market offers many options, each library boasts unique strengths and caters to different project needs and preferences. Factors like ease of use, customization capabilities, performance, specific chart types, and integration with existing tools should guide your selection. Here are the key takeaways to remember:- React chart libraries simplify the process of building data visualizations within React applications.
- A diverse range of libraries exists, each offering unique features and functionalities.