Modern web applications generate and display more data than ever. They create from business dashboards and financial reports to analytics platforms and SaaS products. While data grids are excellent for presenting detailed records, they often make it difficult to identify trends, patterns, and outliers at a glance.
This is where React graphs and JavaScript data grids work together. Interactive charts provide a visual overview of your data, while data grids allow users to search, filter, sort, and examine individual records. Combining both creates a more intuitive experience that helps users explore data faster and make better decisions.
In this guide, you’ll learn how to integrate React graphs with a JavaScript data grid using FusionCharts. We’ll cover the benefits of combining charts with grids, explore real-world use cases, and walk through the steps to build an interactive data visualization interface for your React applications.
Table of Contents
TL;DR
- Learn how to integrate React graphs with a JavaScript data grid to build more interactive and user-friendly dashboards.
- Discover why combining charts and data tables helps users analyze trends while exploring detailed records in the same interface.
- Explore real-world use cases across marketing, sales, finance, healthcare, retail, manufacturing, logistics, and SaaS applications.
- Follow a step-by-step tutorial to build a React dashboard using FusionCharts and a shared dataset displayed as both a chart and a data table.
- Learn best practices for synchronizing charts and tables, improving responsiveness, optimizing performance, and creating better data exploration experiences.
What Are React Graphs?
React graphs are reusable chart components that allow developers to visualize data within React applications. They can display information in various formats, including bar charts, line charts, pie charts, area charts, and scatter plots, making it easier for users to identify trends, compare values, and explore complex datasets.
Most React graph libraries integrate seamlessly with the React component model, allowing charts to be rendered, updated, and customized using props and state. As application data changes, the graphs automatically re-render, making them well suited for dashboards, reporting tools, analytics platforms, and other data-driven web applications.
Modern React graphs also support interactive features such as tooltips, drill-down, zooming, filtering, and real-time updates. These capabilities transform static visualizations into interactive experiences, enabling users to explore data, uncover insights, and make better decisions without leaving the application.
Learn more: How to Create Interactive React Charts.
Why Use Charts Together with Data Grids?
Charts and data grids serve different purposes, but together they provide a more complete way to explore and analyze data. While charts help users identify patterns, trends, and outliers, data grids present the detailed records behind those visualizations. Combining both enables users to move seamlessly between high-level insights and the underlying data.
For example, a sales manager may notice a sudden drop in revenue on a line chart. Instead of switching to another report, they can immediately examine the corresponding rows in a data grid to identify the affected products, customers, or regions. Likewise, selecting or filtering records in the grid can automatically update the chart, allowing users to visualize only the data they want to analyze.
This combination creates a more intuitive and interactive user experience, making dashboards and analytics applications more valuable for both technical and business users.
| Component | Primary Purpose |
|---|---|
| Data Grid | Displays detailed records with sorting, filtering, searching, and pagination. |
| React Chart | Visualizes trends, comparisons, distributions, and relationships within the data. |
| Together | Combines detailed data exploration with visual insights for faster, more informed decision-making. |
Whether you’re building a business dashboard, financial reporting tool, CRM, or analytics platform, integrating React charts with a JavaScript data grid helps users understand both the “what” and the “why” behind their data.
Benefits of Combining React Charts and Data Grids
Using React charts alongside JavaScript data grids creates a richer data analysis experience than using either component alone. Charts help users quickly understand trends and relationships, while data grids provide the detailed records needed to validate findings and investigate specific data points. Together, they enable faster exploration, more informed decision-making, and a better overall user experience.
| Benefit | Business Value |
|---|---|
| Better Analysis | Identify trends, patterns, and anomalies more quickly by combining visual insights with detailed records. |
| Rich Visualization | Present complex datasets in an intuitive format that is easier for users to understand and interpret. |
| Interactive Exploration | Let users filter, sort, search, and drill into data without leaving the dashboard or switching between reports. |
| Real-Time Updates | Display live data in both charts and grids, allowing teams to monitor KPIs and respond to changing conditions faster. |
| Improved User Experience | Give users the flexibility to move between high-level visualizations and detailed data, making analysis more efficient and intuitive. |
| Responsive Design | Deliver a consistent experience across desktops, tablets, and mobile devices, ensuring data remains accessible wherever users work. |
Whether you’re building analytics dashboards, reporting tools, CRM systems, or business intelligence applications, combining React charts with JavaScript data grids helps users gain deeper insights while improving the usability of your application.
Real-World Examples of React Charts and Data Grids
From business intelligence platforms to customer-facing dashboards, React charts and JavaScript data grids are used together across many industries. Charts provide a visual summary of key metrics, while data grids allow users to filter, sort, and examine the detailed records behind those insights.
Marketing
Problem: Marketing teams need to identify which campaigns generate the highest return on investment (ROI).
React Chart: A line chart and bar chart compare campaign performance across channels and time periods.
Data Grid: Displays campaign-level metrics such as impressions, clicks, conversions, cost, and ROI.
Business Outcome: Marketers quickly identify top-performing campaigns, optimize advertising budgets, and improve future marketing strategies.
Sales
Problem: Sales managers need visibility into revenue trends and regional performance.
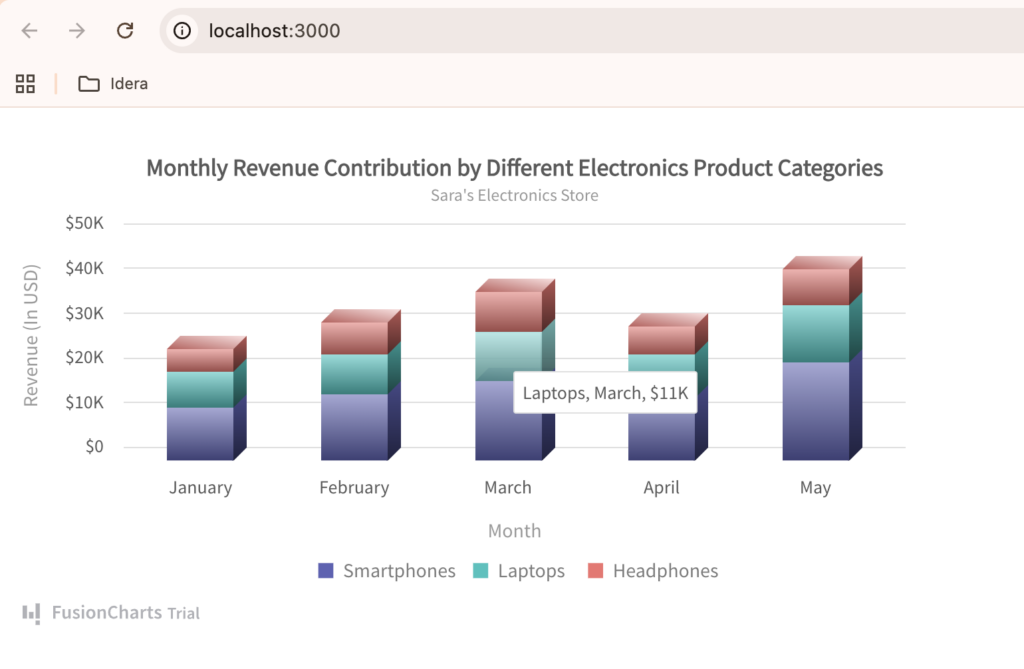
React Chart: Interactive column and line charts visualize monthly sales, revenue growth, and regional performance.
Data Grid: Lists orders, customers, sales representatives, and product details with filtering and sorting.
Business Outcome: Sales teams monitor performance more effectively, identify growth opportunities, and improve forecasting.
Finance
Problem: Finance teams need to analyze revenue, expenses, and cash flow across departments.
React Chart: Area and line charts display financial trends and budget performance.
Data Grid: Shows detailed transactions, invoices, and expense records.
Business Outcome: Financial analysts identify spending patterns earlier and make more informed budgeting decisions.
Healthcare
Problem: Hospitals need to monitor patient admissions, resource utilization, and operational efficiency.
React Chart: Time-series charts visualize admissions, occupancy rates, and patient trends.
Data Grid: Displays patient records, department statistics, and appointment schedules.
Business Outcome: Healthcare providers improve resource planning and deliver better patient care.
Retail
Problem: Retailers need to track sales performance and inventory across multiple stores.
React Chart: Bar charts compare product categories, store performance, and seasonal sales trends.
Data Grid: Lists inventory levels, product information, orders, and supplier details.
Business Outcome: Retail managers optimize inventory, reduce stock shortages, and improve sales performance.
Manufacturing
Problem: Operations teams need to monitor production output and equipment performance.
React Chart: Line charts and gauges display production rates, downtime, and equipment utilization.
Data Grid: Contains machine status, maintenance schedules, and production records.
Business Outcome: Manufacturers identify bottlenecks faster, reduce downtime, and improve operational efficiency.
Logistics
Problem: Logistics companies need real-time visibility into shipments and delivery performance.
React Chart: Maps and line charts track shipment progress, delivery times, and fleet performance.
Data Grid: Displays shipment details, delivery status, routes, and tracking information.
Business Outcome: Logistics teams improve delivery efficiency, reduce delays, and enhance customer satisfaction.
SaaS
Problem: SaaS businesses need to monitor customer growth, subscription revenue, and product usage.
React Chart: Interactive dashboards visualize monthly recurring revenue (MRR), active users, customer churn, and feature adoption.
Data Grid: Lists customer accounts, subscriptions, usage statistics, and support activity.
Business Outcome: Product and growth teams gain deeper customer insights, improve retention, and make more data-driven product decisions.
These examples demonstrate how combining React charts with JavaScript data grids creates a more complete data exploration experience. Users can quickly identify trends through visualizations and immediately investigate the underlying records, leading to faster analysis and more confident decision-making.
How to Integrate React Charts with a JavaScript Data Grid
In this example, we’ll use FusionCharts to render a React chart and a simple HTML table to display the related data records. This approach demonstrates how charts and data grids can work together in a React application, allowing users to view high-level trends while also exploring the underlying data.
Step 1: Create a React Project
Start by creating a new React application.
npx create-react-app react-chart-grid-demo
cd react-chart-grid-demo
Step 2: Install FusionCharts
Install FusionCharts and the React wrapper.
npm install fusioncharts react-fusioncharts
FusionCharts provides the charting library, while react-fusioncharts allows you to use FusionCharts as a React component.
Step 3: Prepare Shared Data
Create a shared dataset that both the chart and grid can use.
src/data/salesData.js
const salesData = [
  { product: "Laptop", region: "North", sales: 42000, orders: 120 },
  { product: "Mobile", region: "South", sales: 35000, orders: 95 },
  { product: "Tablet", region: "East", sales: 28000, orders: 75 },
  { product: "Monitor", region: "West", sales: 22000, orders: 60 }
];

export default salesData;
For the chart, convert the same data into FusionCharts format.
import salesData from "../data/salesData";

const chartData = salesData.map((item) => ({
  label: item.product,
  value: item.sales
}));
Step 4: Render the React Chart
Create a FusionCharts configuration and render it using the React component.
src/components/SalesChart.jsx
import FusionCharts from "fusioncharts";
import Charts from "fusioncharts/fusioncharts.charts";
import ReactFusioncharts from "react-fusioncharts";
import salesData from "../data/salesData";

ReactFusioncharts.fcRoot(FusionCharts, Charts);

const chartConfig = {
  type: "column2d",
  width: "100%",
  height: "350",
  dataFormat: "json",
  dataSource: {
    chart: {
      caption: "Sales by Product",
      xAxisName: "Product",
      yAxisName: "Sales",
      theme: "fusion"
    },
    data: salesData.map((item) => ({
      label: item.product,
      value: item.sales
    }))
  }
};

function SalesChart() {
  return <ReactFusioncharts {...chartConfig} />;
}

export default SalesChart;
src/App.js
import SalesChart from "./components/SalesChart";

function App() {
  return (
    <div>
      <h2>React Chart and JavaScript Data Grid Example</h2>
      <SalesChart />
    </div>
  );
}

export default App;
Step 5: Render the Data Table
After rendering the chart, add a simple HTML table below it to display the detailed data records. Using the same dataset for both the chart and the table allows users to view high-level trends while also exploring the underlying information.
src/components/SalesGrid.jsx
// src/components/SalesGrid.jsx

import salesData from "../data/salesData";

function SalesGrid() {
  return (
    <table>
      <thead>
        <tr>
          <th>Product</th>
          <th>Region</th>
          <th>Sales</th>
          <th>Orders</th>
        </tr>
      </thead>
      <tbody>
        {salesData.map((item) => (
          <tr key={item.product}>
            <td>{item.product}</td>
            <td>{item.region}</td>
            <td>{item.sales}</td>
            <td>{item.orders}</td>
          </tr>
        ))}
      </tbody>
    </table>
  );
}

export default SalesGrid;
Note: This tutorial uses a basic HTML table to demonstrate the chart-and-grid integration pattern. For production applications that require advanced data grid features such as sorting, filtering, search, pagination, and export, you can use a dedicated JavaScript data grid solution.
Then import it in App.js:
import SalesGrid from "./components/SalesGrid";
Step 6: Display the Chart and Grid Together
Now add both components to the same dashboard layout.
src/App.js
import SalesChart from "./components/SalesChart";
import SalesGrid from "./components/SalesGrid";

function App() {
  return (
    <div>
      <h2>React Chart and JavaScript Data Grid Example</h2>

      <SalesChart />

      <h3>Sales Details</h3>

      <SalesGrid />
    </div>
  );
}

export default App;
Your project structure should now be:
src/
├── App.js
├── data/
│   └── salesData.js
└── components/
    ├── SalesChart.jsx
    └── SalesGrid.jsx
Where each file has a clear responsibility:
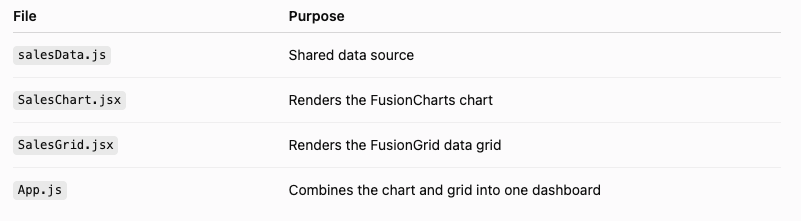
This gives users two ways to explore the same data. The React chart shows the overall sales comparison, while the JavaScript data grid displays the product, region, sales, and order details.
Output in the Browser
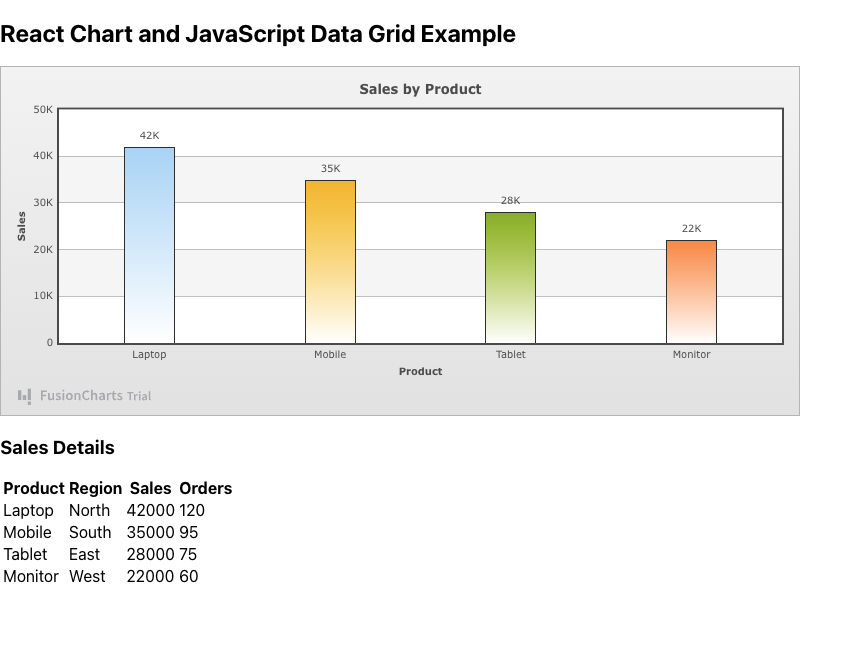
When you run the React application, you’ll see a dashboard that combines a FusionCharts column chart with a data table displaying the underlying records. The chart provides a quick visual summary of sales by product, while the table makes it easy to review the detailed data behind each value. Together, they create a simple yet effective interface for exploring business data.
The final output should look similar to the following:
Source Code: You can find the complete React example used in this tutorial on GitHub.
Step 7: Synchronize Chart and Grid Interactions
To make the experience more interactive, you can synchronize actions between the chart and grid.
For example:
| User Action | Result |
|---|---|
| Click a row in the grid | Highlight or update the related chart data. |
| Filter the grid | Update the chart to show only filtered records. |
| Click a chart column | Display matching rows in the grid. |
| Change the dataset | Refresh both the chart and grid together. |
This approach helps users move from visual insights to detailed records without leaving the dashboard. For example, if a user notices that laptop sales are the highest in the chart, they can immediately review the related product and regional data in the grid.
By combining FusionCharts with a JavaScript data grid or data table, developers can build React dashboards that support both visual analysis and detailed data exploration in a single interface.
Best Practices for Combining React Charts and Data Grids
To build dashboards that are both informative and easy to use, follow these best practices when integrating React charts with data grids.
Keep the Chart and Grid Synchronized
Charts and data grids should always display the same dataset. When users filter, sort, or search the data grid, the chart should update accordingly. Likewise, selecting a data point in the chart can highlight or filter the corresponding records in the grid. Keeping both components synchronized provides a consistent user experience.
Avoid Duplicating Information
Use charts and tables for different purposes instead of displaying the same information twice. Charts are ideal for highlighting trends, comparisons, and patterns, while data grids are better suited for detailed records and precise values.
Use Consistent Colors
Maintain consistent colors across charts and related table elements. For example, if a product category is shown in blue on the chart, use the same color for related indicators or labels in the data grid. This makes it easier for users to associate visualizations with their underlying data.
Enable Filtering
Provide filters such as date ranges, product categories, regions, or departments so users can quickly focus on the information that matters most. Dynamic filtering makes dashboards far more useful than static reports.
Design for Responsive Layouts
Ensure charts and data tables display correctly across desktops, tablets, and mobile devices. Responsive layouts help users access business insights wherever they work.
Optimize for Large Datasets
Rendering thousands of records at once can affect performance. Consider aggregating data in charts, limiting the number of visible rows, or loading only the most relevant information by default.
Use Lazy Loading When Appropriate
For applications with large datasets, lazy loading or pagination reduces initial load time by retrieving additional records only when users need them. This improves performance and creates a smoother user experience.
Why Use FusionCharts with React?
React provides an excellent foundation for building interactive dashboards, while FusionCharts simplifies creating rich, responsive data visualizations. Instead of building charting functionality from scratch, developers can integrate FusionCharts into React applications using its dedicated React wrapper.
FusionCharts supports over 100 chart types, allowing developers to build everything from simple bar charts to advanced time-series visualizations, heatmaps, and combination charts. It also includes features commonly required in business dashboards, including:
- Real-time chart updates for live data
- Drill-down functionality for exploring detailed information
- Event handling for user interactions such as clicks and selections
- Responsive layouts that adapt to different screen sizes
- Built-in export options for sharing charts as images or PDFs
- Accessibility features that improve usability for a wider range of users
These capabilities make FusionCharts a practical choice for developers building React dashboards, analytics platforms, reporting systems, and other data-driven web applications.
React Charts: FAQs
What are React charts?
React charts are chart components that integrate with React applications to visualize data using charts such as bar charts, line charts, pie charts, area charts, and more. They help developers build interactive dashboards and data-driven user interfaces.
What is the best React chart library?
The best React chart library depends on your project requirements. Factors to consider include the available chart types, performance, customization options, documentation, responsiveness, accessibility, and support for real-time data.
Can React charts update in real time?
Yes. Many React chart libraries support real-time updates by connecting to live data sources or APIs. As new data arrives, the charts can update automatically without requiring a full page refresh.
Can React charts work with data grids?
Yes. React charts are commonly used alongside data grids in dashboards and reporting applications. Charts provide high-level visual summaries, while data grids display the detailed records behind the visualizations.
How do I connect React charts to AG Grid?
React charts can be connected to AG Grid by sharing the same data source and synchronizing user interactions. For example, filtering or selecting rows in the grid can update the chart, while clicking chart elements can filter or highlight matching rows in the grid.
Which chart is best for dashboards?
There is no single best chart for every dashboard. Line charts work well for trends, bar charts compare categories, pie or donut charts show proportions, and KPI cards summarize key metrics. The best choice depends on the data being presented.
Can FusionCharts be used with React?
Yes. FusionCharts provides a React integration that allows developers to build interactive charts within React applications. It supports a wide range of chart types, responsive layouts, real-time updates, and interactive features.
What is the difference between a chart and a data grid?
A chart visualizes data to reveal trends, patterns, and comparisons, making it easier to understand information at a glance. A data grid displays detailed records in rows and columns, allowing users to search, sort, filter, and inspect individual data values.
Conclusion
Modern React applications often need both visual insights and detailed data exploration. By combining interactive charts with a data table or JavaScript data grid, developers can build dashboards that help users identify trends, investigate underlying records, and make better decisions.
This approach works well for a wide range of applications, including business intelligence dashboards, sales reporting, financial analytics, healthcare systems, SaaS platforms, logistics tracking, and operational monitoring.
If you’re building a React application that requires interactive data visualization, explore FusionCharts’ React integration, experiment with different chart types, and customize your dashboards to deliver a more engaging and informative user experience.
Ready to build interactive React dashboards? Start your free FusionCharts trial and explore over 100 chart types, real-time visualizations, drill-down capabilities, and responsive charts for your next React application.