Data visualization tools are undeniably important in the day-to-day operations of small, medium, and large enterprises. They play a key role in tracking progress and monitoring key performance metrics and parameters. It would be impossible to understand data patterns without these tools. This is because raw statistics and numbers on a spreadsheet are difficult to comprehend, navigate, and interpret.
If you are a react developer looking to master React graphs, then you have come to the right place. React Graph is one of the best strategic ways to show data in a simple and easy-to-understand way to visualize it using graphs (charts).
Read on to find out how you can gain skills at creating React Graphs using the FusionCharts React component in just 6 easy to follow simple steps. Now let’s get started.
Table of Contents
Step 1: How Do I Create a React Project?
First, create a project called my-react-graph and switch to this directory. Type the following on the command line:
npx create-react-app first-fusioncharts-project
cd first-fusioncharts-project
Step 2: How Do I Install and Include Dependencies?
The second step is to install and include dependencies of the FusionCharts React component. Type the following at the command line:
npm install fusioncharts react-fusioncharts --saveAfter installing all dependencies open the App.js file in the src project directory. Delete all its contents and add the following at the start of the file to include all the FusionCharts dependencies:
import React from "react";
import ReactDOM from "react-dom";

// Include the react-fusioncharts component
import ReactFC from "react-fusioncharts";

// Include the fusioncharts library
import FusionCharts from "fusioncharts";

// Include the chart type
import Column2D from "fusioncharts/fusioncharts.charts";

// Include the theme as fusion
import FusionTheme from "fusioncharts/themes/fusioncharts.theme.fusion";

//Import FusionMaps. Omit if not needed
import FusionMaps from 'fusioncharts/maps/es/fusioncharts.world';
import World from 'fusioncharts/fusioncharts.maps'

// Adding the chart and theme as dependency to the core fusioncharts
// You can omit the components you don't need (column2D, FusionMaps, World)
ReactFC.fcRoot(FusionCharts, Column2D, FusionMaps, World, FusionTheme);
Step 3: How Do I Prepare the Data for React Graph?
We’ll use a very simple dataset to illustrate how easy it is to create React graphs. Here is the world’s continent data from enchantedlearning.com. You can paste it at the end of the App.js file.
const continentData = [
    {
      id: "NA",
      label: "North America",
      value: "16.3",
      showLabel: "1"

    },
    {
      id: "SA",
      label: "South America",
      value: "12.0",
      showLabel: "1"
    },
    {
      id: "AS",
      label: "Asia",
      value: "30.0",
      showLabel: "1"
    },
    {
      id: "EU",
      label: "Europe",
      value: "6.7",
      showLabel: "1"
    },
    {
      id: "AF",
      label: "Africa",
      value: "20.3",
      showLabel: "1"
    },
    {
      id: "AU",
      label: "Australia",
      value: "5.2",
      showLabel: "1"
    }
  ];
Step 4: How Do I Add React Graph Configuration?
After defining your data source, you need to add a JSON object for the corresponding chart configuration. If you want to add a bar chart, add the following to the end of App.js file:
const reactGraphConfigs = {
  type: "column2d", // The chart type
  width: "700", // Width of the chart
  height: "600", // Height of the chart
  dataFormat: "json", // Data type
  dataSource: {
    // Chart Configuration
    chart: {
       caption: "Percentage of Land Area on Planet Earth",
       subCaption: "Data Source: www.enchantedlearning.com",
       xAxisName: "Continent",
       yAxisName: "Percentage Land Area",
       numberSuffix: "%",
       theme: "umber"
    },
    // Chart Data
    data: continentData
  }
};
Step 5: How Do I Render and View the React Graph?
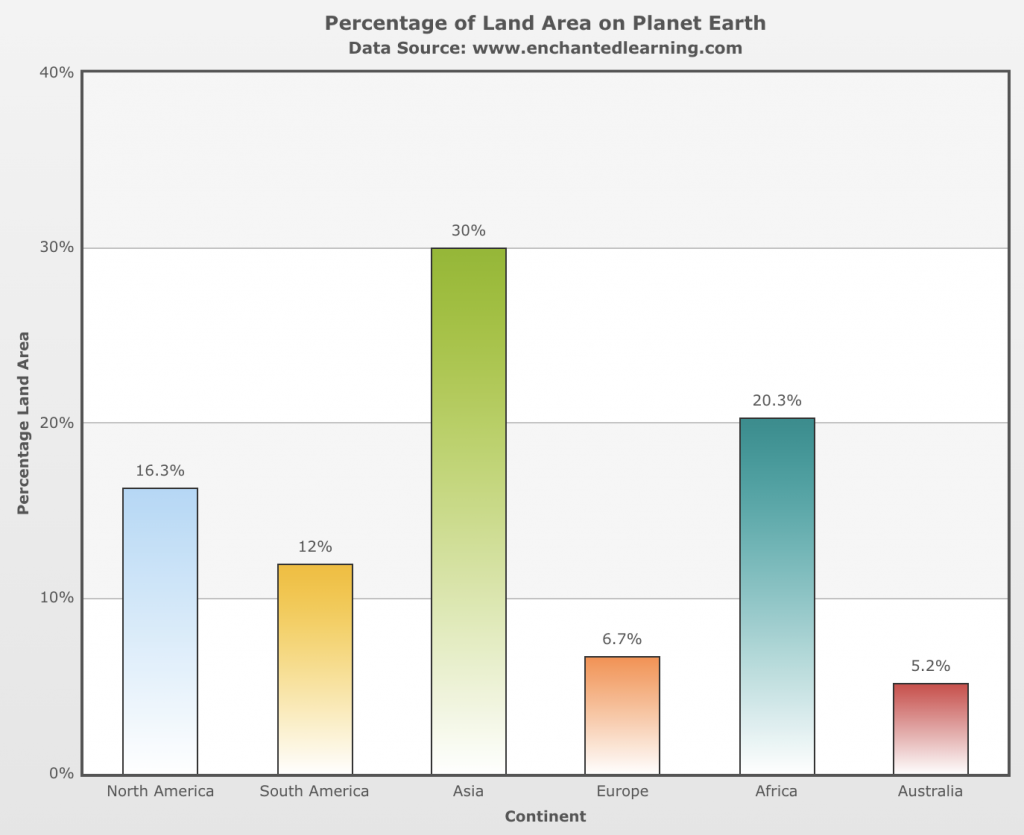
To Render the React graph, add the following to the end of the App.js file:
class App extends React.Component {
  render() {
    return (<ReactFC {...reactGraphConfigs} />);
  }
}

export default App;
To view the React graph at the command prompt, type:
npm startThis will automatically load the following React graph in the browser:
Step 6: How Do I Create a Map in React?
If you want to create a map with the same data, add the map configuration to the App.js file as:
const ReactMapConfigs = {
type: "world", // Map type
width: "600", // Width of the chart
height: "400", // Height of the chart
dataFormat: "json", // Data Type
dataSource: {
// Map Configuration
chart: {
caption: "Percentage of Land Area on Planet Earth",
subcaption: "Data Source: www.enchantedlearning.com",
numbersuffix: "%",
includevalueinlabels: "1",
labelsepchar: " - ",
entityFillHoverColor: "#FFF9C4",
theme: "fusion"
},
data: continentData
}
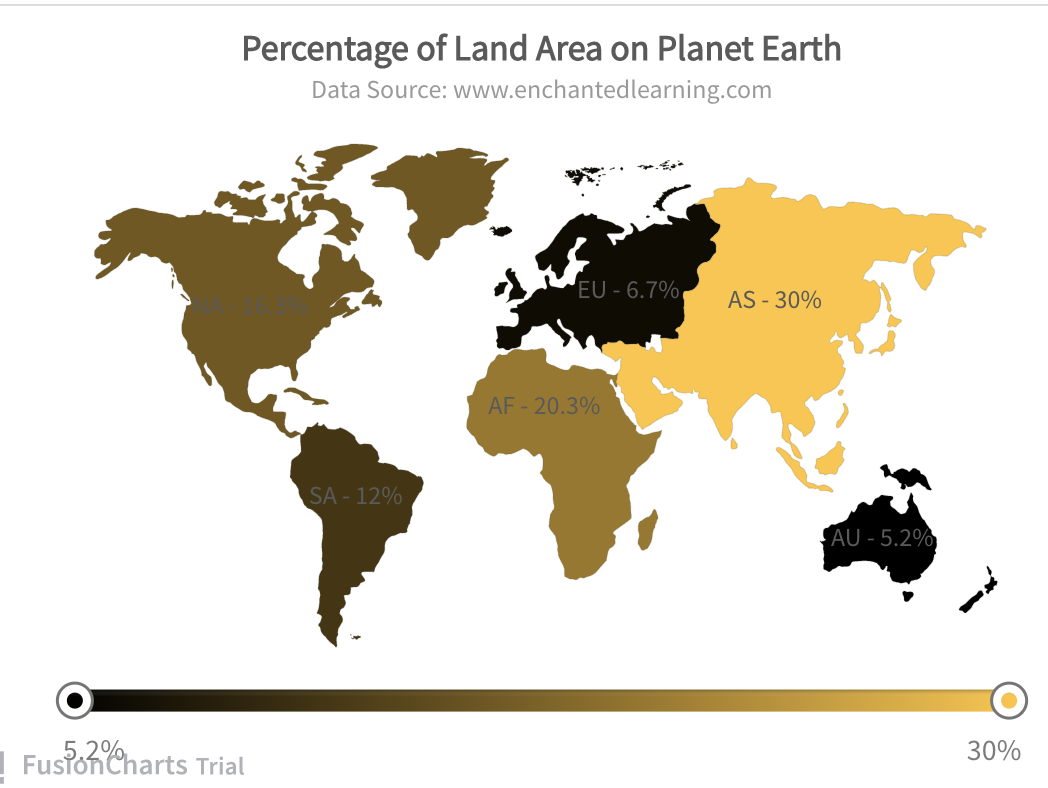
};Next, render the map by replacing the App class with the following:
class App extends React.Component {
  render() {
    return (<ReactFC {...ReactMapConfigs} />);
  }
}

export default App;
In your browser you’ll see the following map:
What is the Consolidated Code For App.js?
Here is the consolidated code for App.js. You can use reactGraphConfigs or reactMapConfigs, depending on what you want to display in the App class.
// *** Include Dependencies ***
// Include react
import React from "react";
import ReactDOM from "react-dom";

// Include the react-fusioncharts component
import ReactFC from "react-fusioncharts";

// Include the fusioncharts library
import FusionCharts from "fusioncharts";

// Include the chart type
import Column2D from "fusioncharts/fusioncharts.charts";

// Include the theme as fusion
import FusionTheme from "fusioncharts/themes/fusioncharts.theme.fusion";

/Import FusionMaps. Omit if not needed
import FusionMaps from 'fusioncharts/maps/es/fusioncharts.world';
import World from 'fusioncharts/fusioncharts.maps'

// Adding the chart and theme as dependency to the core fusioncharts
// You can omit the components you don't need (column2D, FusionMaps, World)
ReactFC.fcRoot(FusionCharts, Column2D, FusionMaps, World, FusionTheme);

// *** Add data source ***
const continentData = [
    {
      id: "NA",
      label: "North America",
      value: "16.3",
      showLabel: "1"

    },
    {
      id: "SA",
      label: "South America",
      value: "12.0",
      showLabel: "1"
    },
    {
      id: "AS",
      label: "Asia",
      value: "30.0",
      showLabel: "1"
    },
    {
      id: "EU",
      label: "Europe",
      value: "6.7",
      showLabel: "1"
    },
    {
      id: "AF",
      label: "Africa",
      value: "20.3",
      showLabel: "1"
    },
    {
      id: "AU",
      label: "Australia",
      value: "5.2",
      showLabel: "1"
    }
  ];


// *** Add JSON object for the React Graph configurations ***
const reactGraphConfigs = {
  type: "column2d", // The chart type
  width: "700", // Width of the chart
  height: "600", // Height of the chart
  dataFormat: "json", // Data type
  dataSource: {
    // Chart Configuration
    chart: {
       caption: "Percentage of Land Area on Planet Earth",
       subCaption: "Data Source: www.enchantedlearning.com",
       xAxisName: "Continent",
       yAxisName: "Percentage Land Area",
       numberSuffix: "%",
       theme: "umber"
    },
    // Chart Data
    data: continentData
  }
};

const ReactMapConfigs = {
    type: "world", // Map type
    width: "600", // Width of the chart
    height: "400", // Height of the chart
    dataFormat: "json", // Data Type
    dataSource: {
      // Map Configuration
      chart: {
        caption: "Percentage of Land Area on Planet Earth",
        subcaption: "Data Source: www.enchantedlearning.com",
        numbersuffix: "%",
        includevalueinlabels: "1",
        labelsepchar: " - ",
        entityFillHoverColor: "#FFF9C4",
        theme: "fusion"
      },
      data: continentData
    }
  };

// *** Creating the DOM element to pass the react-fusioncharts component ***
class App extends React.Component {
  render() {
    //replace by reactGraphConfigs to display the bar chart
    return (<ReactFC {...ReactMapConfigs} />);
  }
}

export default App;
Where Can I Learn More About React Graphs in FusionCharts?
Now that you have mastered rendering a bar chart and a map, creating other React graphs is easy. Explore more React Components for FusionCharts. Don’t forget that no library can beat the FusionCharts library as an out-of-the-box solution for creating React graphs. With beautiful presentations, efficient design, fast rendering, portability, compatibility across all platforms and devices, and lots of more awesome features, FusionCharts is the best charting and graphing library out there.
Don’t wait any longer. Make the most of your data and download FusionCharts today.
