FusionCharts - Idera
  • Products
    • Charts

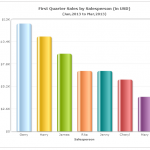
      Plot 100+ charts and 2000+ data-driven maps

    • Time

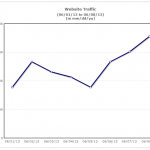
      Plot high performance time-series visualizations

    • Maps

      Export full Dashboards as PDFs for use in reports and emails

    • Grid

      Rocket fuel for data-intensive applications with integrated charting

  • Developer
    • Dev Center (Docs)

      Documentation for FusionCharts, FusionTime and FusionExport

      • FusionCharts Suite XT
      • FusionExport
      • FusionTime
      • FusionGrid
    • Version History

      Version history of FusionCharts, FusionTime and FusionExport

      • FusionCharts Suite XT
      • FusionExport
      • FusionTime
  • Pricing
  • Support
  • Contact Sales Download
  • Products

    • FusionCharts Suite XT

    • FusionTime

    • FusionExport

    • FusionGrid

  • Developer

    • Dev Center (Docs)

    • Integrations

  • Dashboards
  • Data Stories
  • Contact Sales
  • Pricing
  • Download
FusionBrew – The FusionCharts Blog

FusionBrew – The FusionCharts Blog

Get tips and tricks on how to build effective Data Visualisation using FusionCharts

  • Categories
    • Tutorials
    • News & Announcements
    • Showcase
    • Thoughts
    • Charting Guidelines
    • Fun
    • Uncategorized
    • FusionTime
    • Dashboard
Author

Shilpi Choudhury

All Posts by Shilpi Choudhury

August 19, 2013

When to Use Stacked Bar Chart vs Column Chart 2026

in Charting Guidelines
When to Use Stacked Bar Chart vs Column Chart 2026
August 1, 2013

10 Inspiring Fitness App Dashboards: FusionBrew 2026

in Showcase
10 Inspiring Fitness App Dashboards: FusionBrew 2026
July 4, 2013

Celebrating Two Years of Madness at Our Bangalore Office 2013

in Fun
Celebrating Two Years of Madness at Our Bangalore Office 2013
June 21, 2013

Choosing the Right Chart Type: Line Charts vs Area Charts 2026

in Charting Guidelines
Line chart
June 6, 2013

Bar Chart vs Column Chart: Which One Should You Choose 2026

in Charting Guidelines
Column chart vs bar chart
May 20, 2013

5 Quick Fixes to Ugly X-Axis Labels: Design Tips 2026

in Charting Guidelines
5 Quick Fixes to Ugly X-Axis Labels: Design Tips 2026
Load More

Popular Posts

  1. Choosing the Right Chart Type: Line Charts vs Area Charts 2026

    in Charting Guidelines
    Line chart
  2. Bar Chart vs Column Chart: Which One Should You Choose 2026

    in Charting Guidelines
    Column chart vs bar chart
  3. When to Use Stacked Bar Chart vs Column Chart 2026

    in Charting Guidelines
  4. 5 JavaScript Minification Tools to Improve Code Performance 2026

    in Showcase
  5. Build Powerful Personal Finance Dashboards in 2026

    in Showcase

Take your data visualization to a whole new level

From column to donut and radar to gantt, FusionCharts provides with over 100+ interactive charts & 2,000+ data-driven maps to make your dashboards and reports more insightful

Explore FusionCharts
Explore
  • Chart
  • Map
  • Time-series Charts
  • Grid
  • Gannts
Developers
  • Dev Center (Docs)
  • Integrations
  • Version History
Support
  • Pricing and Plans
  • Support And Upgrades
Company
  • Contact Us
  • Legal
  • Privacy Policy
© 2026 FusionCharts - An Idera, Inc. Company. All Rights Reserved.