When calculating the costs and expenses of an enterprise logistics management unit, energy consumption is at the top of the list. Energy units are essential components of a company’s daily operations and should not be overlooked at any stage. However, we cannot ignore the fact that energy is frequently wasted and unmonitored. As a result, significant cost breakdowns occur, as well as disruptions in your monthly budgets.
In a world where businesses are rapidly expanding, automating energy monitoring is especially important for lowering enterprise costs and forecasting future consumption. You may believe that starting an energy monitoring process is a monumental task, but you would be mistaken. FusionCharts includes everything you need to get started quickly with smart energy visualization monitoring and business dashboards.
The best part is that FusionCharts provides developers with complete source code. Simply download it and insert it into your projects to get started. In this post, you’ll learn how to use FusionCharts’ javascript dashboard to automate your energy monitoring.
Table of Contents
How Can I Build a Smart Energy Monitoring Dashboard With FusionCharts?
FusionCharts is one of the very few charting tools that enables you to create interactive, beautiful, and insightful visualizations with ease and precision. Smart energy monitoring is a prime example of this. With FusionCharts, you can quickly make these dashboards, keep track of energy wastage, and optimize your enterprise energy consumption.
Here are some of the critical features of a smart energy monitoring dashboard:
- Identify inefficient rooms that consume excess energy.
- Track the exact usage of electricity and gas power.
- Predict energy consumption based on intelligent analyses of the previous usage levels.
- Set up energy emissions thresholds.
How Can I Track the Energy Consumption of Active Appliances on My Energy Monitoring Dashboard?
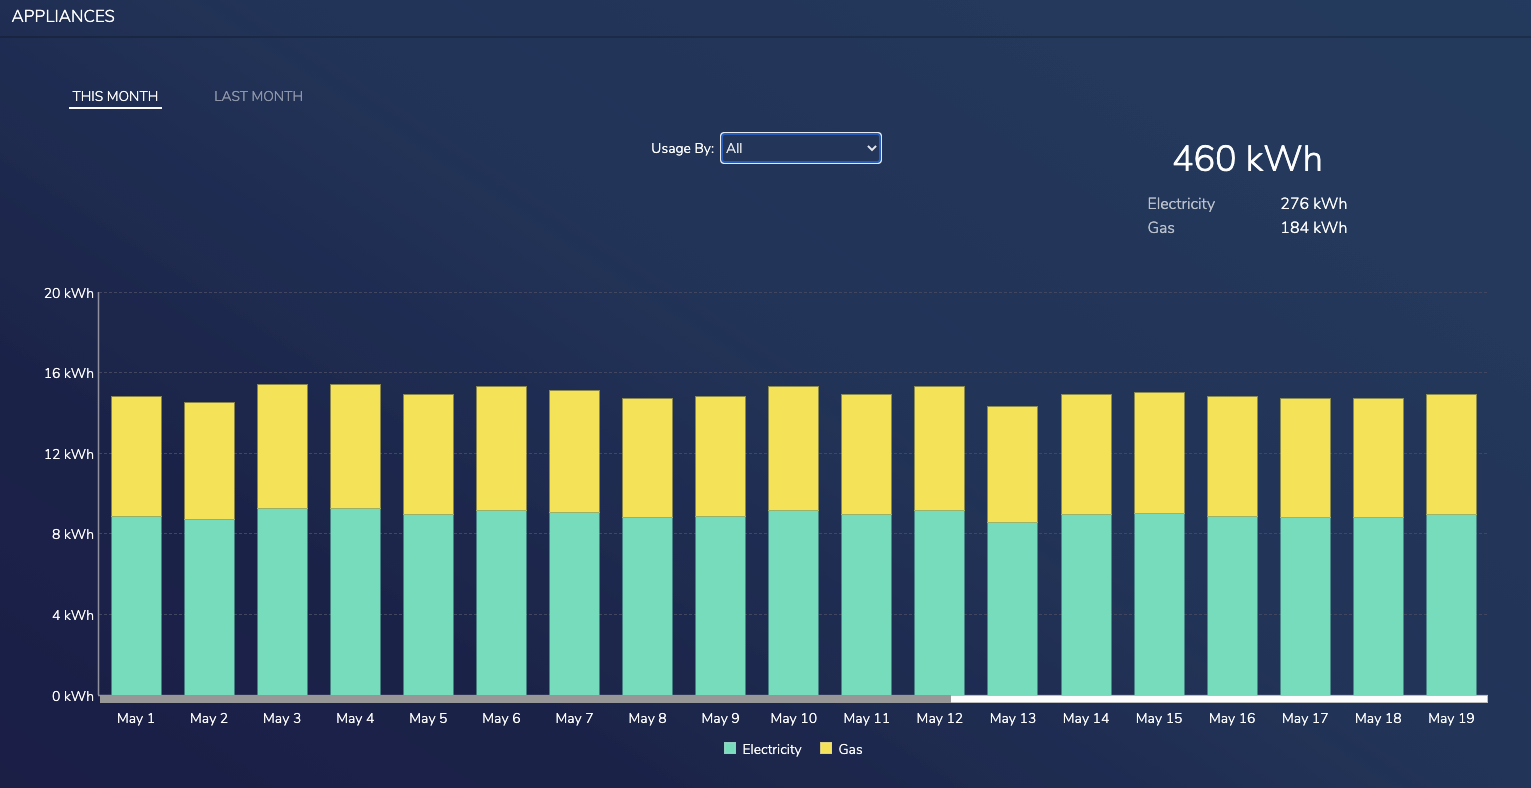
Monitoring the energy consumption of your active appliances is valuable information that you can show on your dashboard. Proper monitoring can help you determine your overall energy consumption and filter out overshooting appliances’ established thresholds. In addition, you can use this metric to control these appliances and optimize their power use.
FusionCharts has a full suite of Bootstrap-based libraries in addition to JavaScript support to help you integrate the active appliances monitoring module into your dashboard.
var monthDataArr_0 = [14.8, 14.5, 15.4, 15.4, 14.9, 15.3, 15.1, 14.7, 14.8, 15.3, 14.9, 15.3, 14.3, 14.9, 15, 14.8, 14.7, 14.7, 14.9, 14.5, 14.4, 14.7, 15.1, 14.6, 14.7, 15.1, 14.5, 14.8, 14.7, 14.8, 14.4];
var dataArr = eval("monthDataArr_" + 0);
var tecVal = 0;
for (var i = 0; i < moment().daysInMonth(); i++) {
    tecVal = tecVal + dataArr[i];
}
var eVal = 0;
var gVal = 0;
for (var i = 0; i < moment().daysInMonth(); i++) {
    eVal = eVal + (0.6 * dataArr[i]);
    gVal = gVal + (0.4 * dataArr[i]);
}
dataSource = buildDataThisMonth("All");
document.getElementById("stats").innerHTML = Math.round(tecVal * 100) / 100 + " kWh";
document.getElementById("elecvalue").innerHTML = Math.round(eVal * 100) / 100 + " kWh";
document.getElementById("gasvalue").innerHTML = Math.round(gVal * 100) / 100 + " kWh";
Here is how your active appliance monitoring component looks on your dashboard.
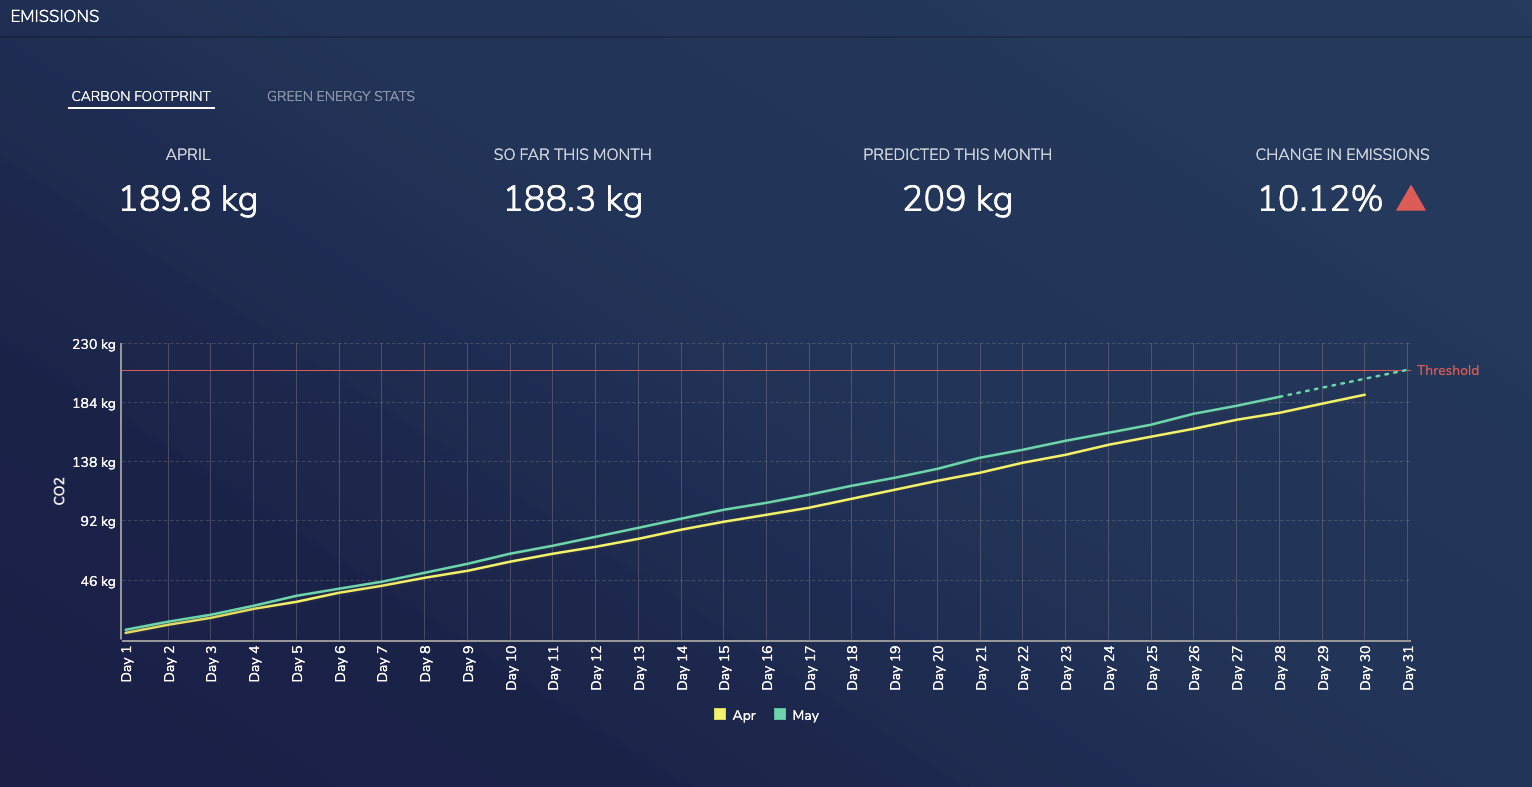
How Can I Easily Monitor the Carbon Footprint in My Dashboard?
Unfortunately, adding a carbon emission monitoring module to your dashboard is not as simple as it might seem. It involves a lot of careful consideration of data and its interpretation in the visualizations. If handled from scratch, all these things can cause a wide range of problems and would also require an enormous amount of effort.
FusionCharts provides a simple mechanism that involves just a few lines of JavaScript code to integrate carbon footprint monitoring into your dashboard. Best of all, the FusionCharts library itself handles everything internally. Take a look!
var cpCalc, cper;
var dataSource;
dataSource = carbonfootprint_month_data;
cpCalc = 0;
for (var i = 0; i < moment().subtract(1, 'month').daysInMonth(); i++) {
    cpCalc = cpCalc + pmArr[i];
}
var cDate = parseInt(moment().format('D'));
var sfmCalc = 0;
for (var i = 0; i < cDate; i++) {
    sfmCalc = sfmCalc + cmArr[i];
}
var pmcpCalc = 0;
for (var i = 0; i < moment().daysInMonth(); i++) {
    pmcpCalc = pmcpCalc + cmArr[i];
}
if (pmcpCalc > cpCalc) {
    cper = Math.round(([(pmcpCalc / cpCalc) * 100] - 100) * 100) / 100;
    document.getElementById("em-tablecell-value4").innerHTML = cper + "% <span style='color: #EF5052;'>▲</span>"
}
else if (pmcpCalc < cpCalc) {
    cper = Math.round((100 - [(pmcpCalc / cpCalc) * 100]) * 100) / 100;
    document.getElementById("em-tablecell-value4").innerHTML = cper + "% <span style='color: #B4F9A1;'>▼</span>"
}
document.getElementById("em-tablecell-title1").innerHTML = moment().subtract(1, 'month').format('MMMM');
document.getElementById("em-tablecell-value1").innerHTML = Math.round(cpCalc * 100) / 100 + "  kg";
document.getElementById("em-tablecell-title2").innerHTML = "So Far This Month";
document.getElementById("em-tablecell-value2").innerHTML = Math.round(sfmCalc * 100) / 100 + "  kg"
document.getElementById("em-tablecell-title3").innerHTML = "Predicted This Month";
document.getElementById("em-tablecell-value3").innerHTML = Math.round(pmcpCalc * 100) / 100 + "  kg"
document.getElementById("em-tablecell-title4").innerHTML = "Change in Emissions";
Here is how your carbon footprint tracking component in the dashboard looks like.
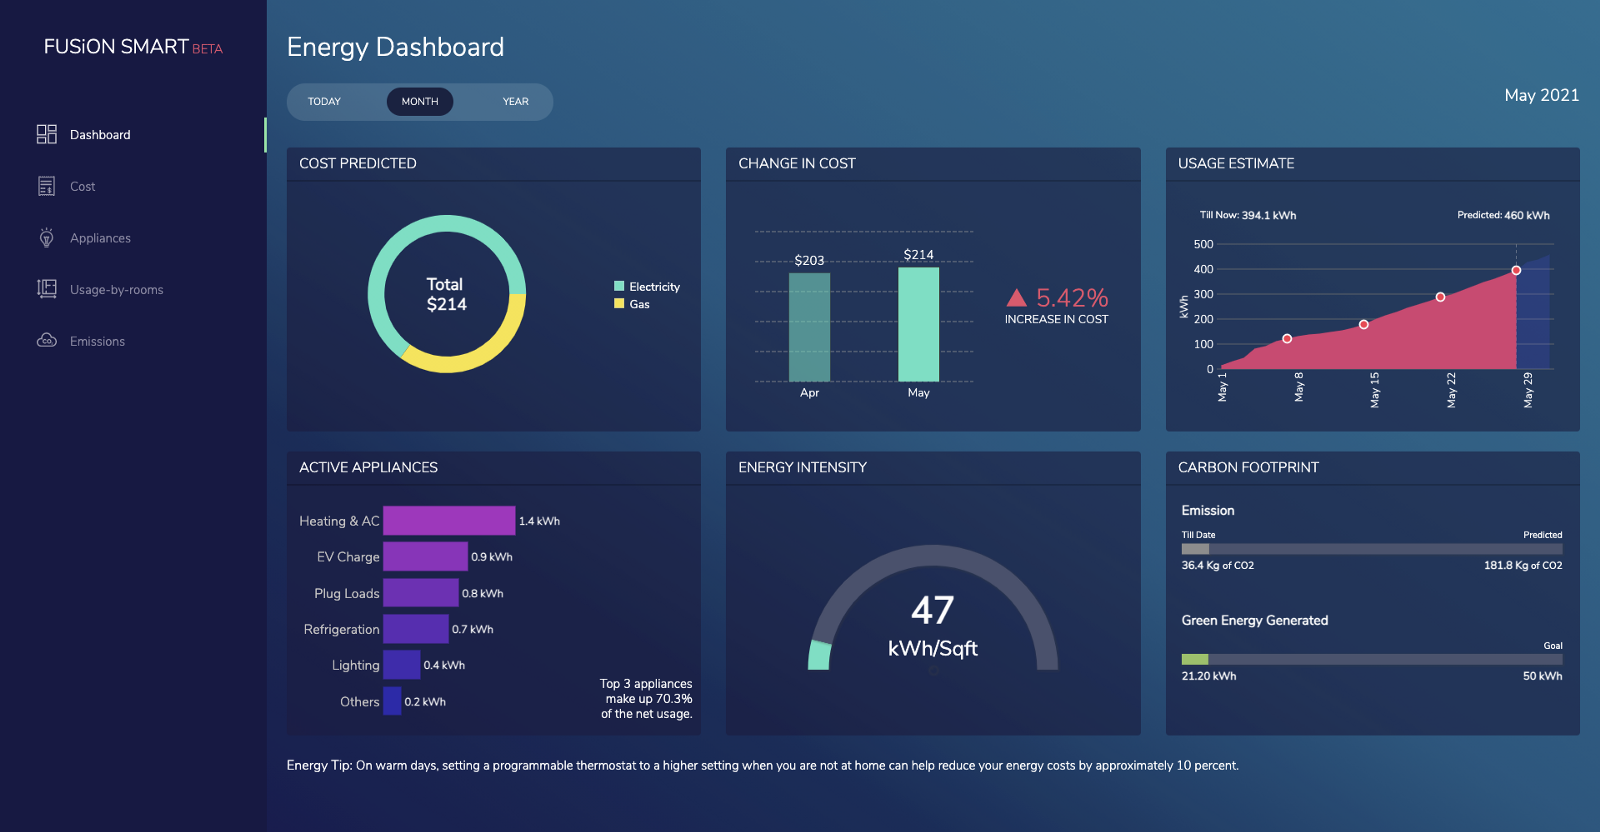
What is an All-in-One Energy Dashboard?
When you put all of the components together, you end up with an information-rich dashboard that gives you all the information you need to take control of your energy consumption.
Source Code for Smart Energy Monitoring Dashboard
Smart Energy Monitoring Dashboard Demo
As you can see, FusionCharts has made it easy to design and develop an energy monitoring dashboard for your use case. FusionCharts supports a wide variety of bindings for Javascript, Angular, React, jQuery, Vue.js, and Ember. In addition, it supports React Native, AngularJS, Svelte, ASP.NET, PHP, Java, Ruby on Rails, and Django.
In the comment section below, let us know how you used FusionCharts to create your smart energy monitoring dashboard.
You can get started by Downloading FusionCharts today!
