Despite the growing number of technologies, Microsoft’s ASP.NET remains one of the most popular server-side web application frameworks. Because ASP.NET is a closed-source and reliable platform, it has a high adoption rate among small businesses and enterprises. Because companies are generally unsatisfied with switching platforms on a regular basis, ASP.NET remains the most widely used framework. To attract more developers, Microsoft decided to open-source the entire platform in response to the growth of startups.
In this post, we’ll walk you through a step-by-step procedure for using the ASP.NET plugin for FusionCharts to create Live Charts for your web applications.
Table of Contents
Dynamic Pages in ASP.NET
With this model, ASP.NET developer has to write code to respond to different events, such as page load events or clicks.
To increase the efficiency and performance of the web applications built using ASP.NET, Microsoft introduced the code-behind model that keeps the static text on the main .aspx page. At the same time, the dynamic code is rendered from a separate file. The new model is highly recommended for building dynamic pages. This process is the default standard for the Visual Studio and many other new IDEs, where a .aspx.vb or .aspx.cs or .aspx.fs file is automatically generated with the same file name.
In situations with the MVC Using Entity Framework Database First Approach, you can instantly generate HTML for Dynamic Page. Additionally, you need to create Views For Each Controller to display dynamic or static data. You can Fetch Data From Database, fill it in Viewbag, Model, or ViewModel, then use that Viewbag, Model, ViewModel, etc., to send data from the controller to view to display dynamic data.
In this tutorial, we will see how we can simplify creating charts in web applications by integrating the FusionCharts library with ASP.NET. For doing this, we will use the ASP.NET wrapper provided by FusionCharts for charting in ASP.NET.
Requirements
Before we start, we have to check for the following requirements to proceed:
- Visual Studio IDE and .NET Framework – Can be downloaded from here.
- FusionCharts ASP.NET Wrapper – Is available for download in FusionCharts Extensions.
Creating the Chart Element in ASP.NET
We will now take you through the steps integrating the FusionCharts library with ASP.NET to create charts:
Step 1
First, we create an empty app – to do this, open Visual Studio. To create a new web application, click File > New > Web Site.
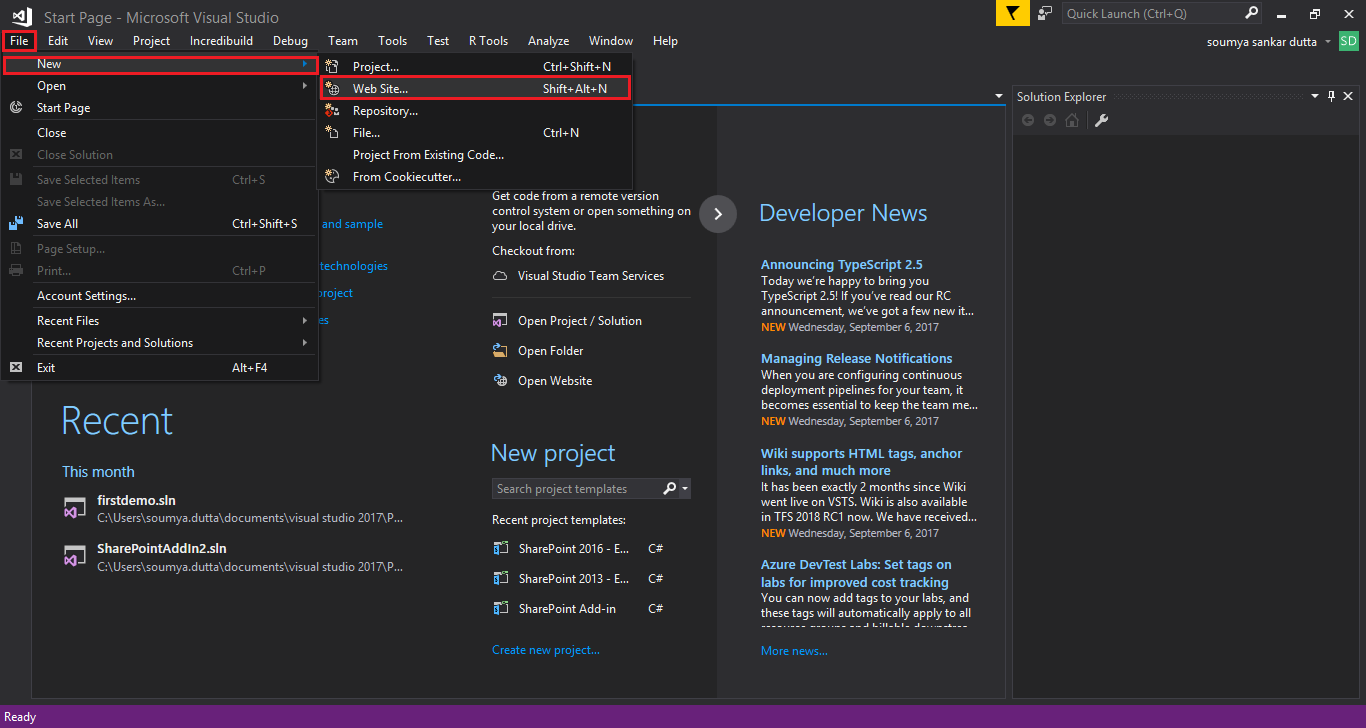
The New Web Site dialog box opens.
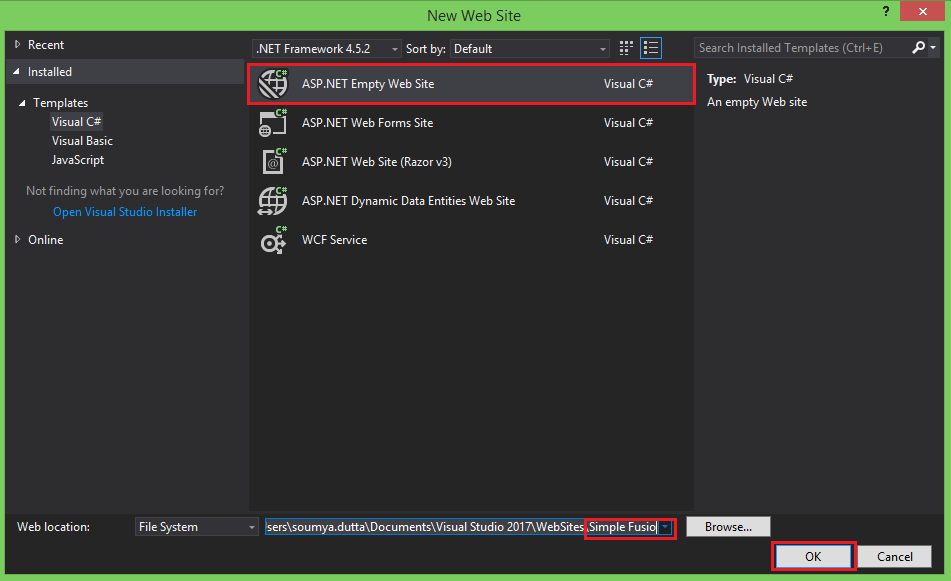
Step 2
From the New Web Site dialog box, select ASP.NET Empty Web Site. Enter the website name and click OK.
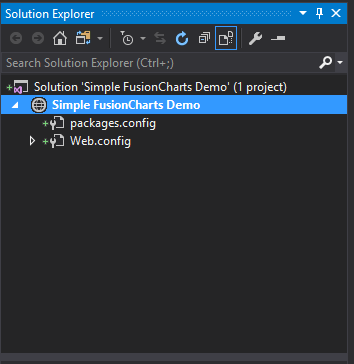
As shown in the image below, the Solution Explorer with an empty web application and web hierarchy renders at the right of the New Web site window.
Step 3
To configure your web app, right-click over the website name and select Add. Click the Add New Item option.
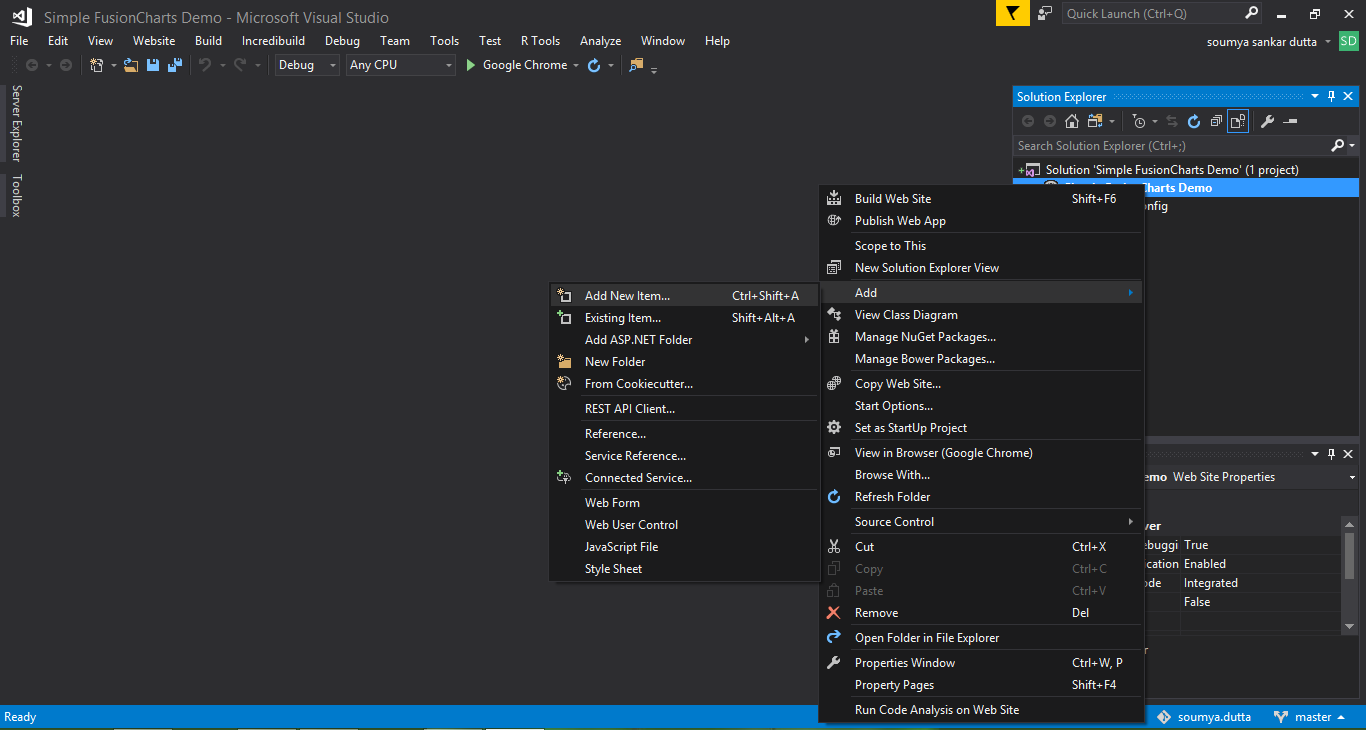
The Add New Item a dialog box opens.
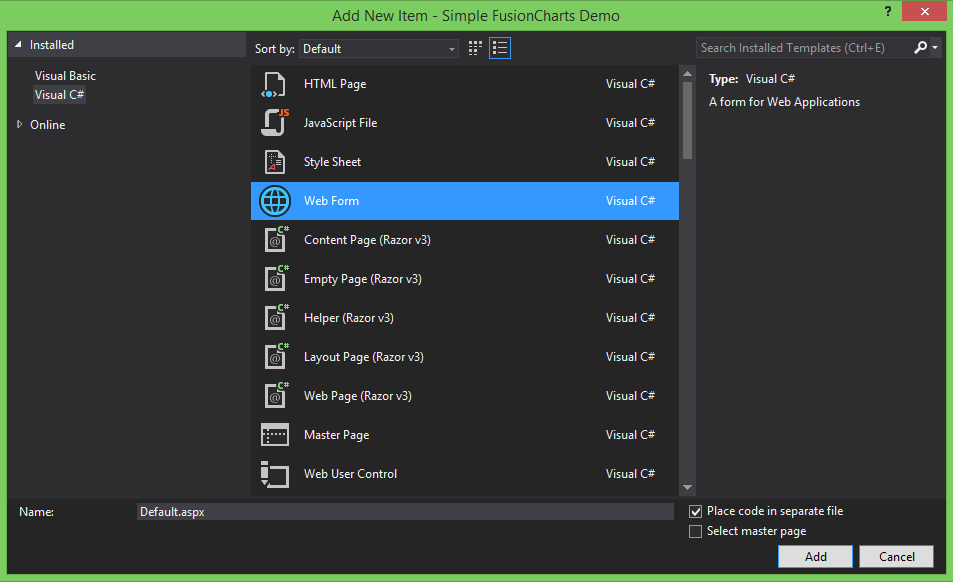
Step 4
From the Add New Item dialog box, in the list of available templates, select Web Form. Click Add to connect the template to your app.
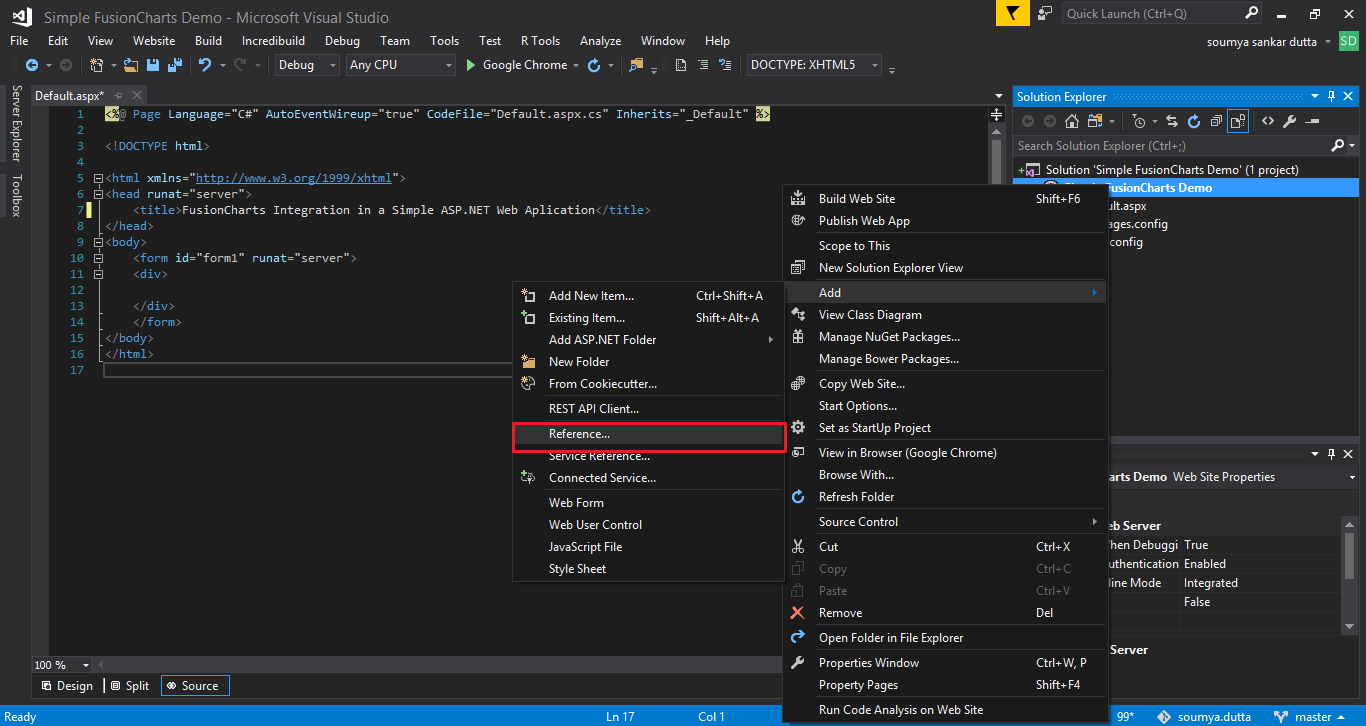
Step 5
Next, we need to integrate the FusionCharts library with ASP.NET. In the Solution Explorer, right-click over the website name and select Add and click Reference.
The Reference Manager dialog box opens.
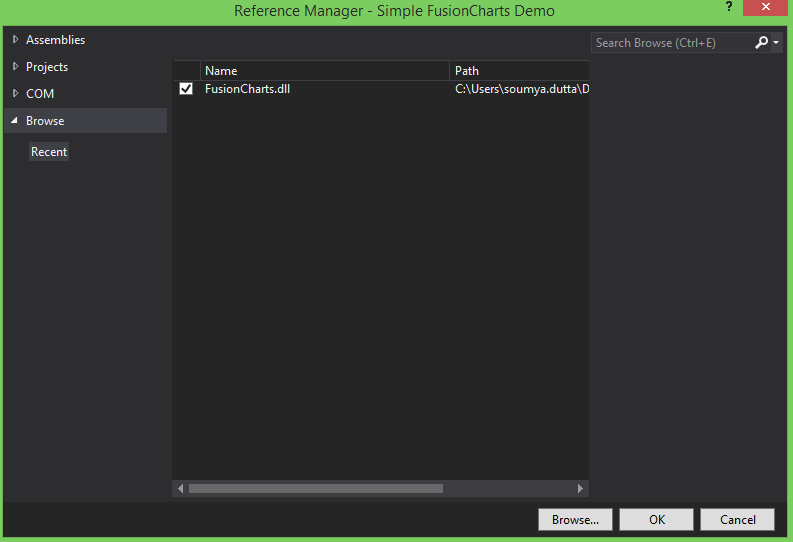
Step 6
From the Reference Manager dialog box, select Browse. From the list of packages available, select FusionCharts.dll. Click OK.
Step 7
From the Solution Explorer, right-click on the website name and select Add. Click New Folder to create a new folder. Rename this folder to Scripts.
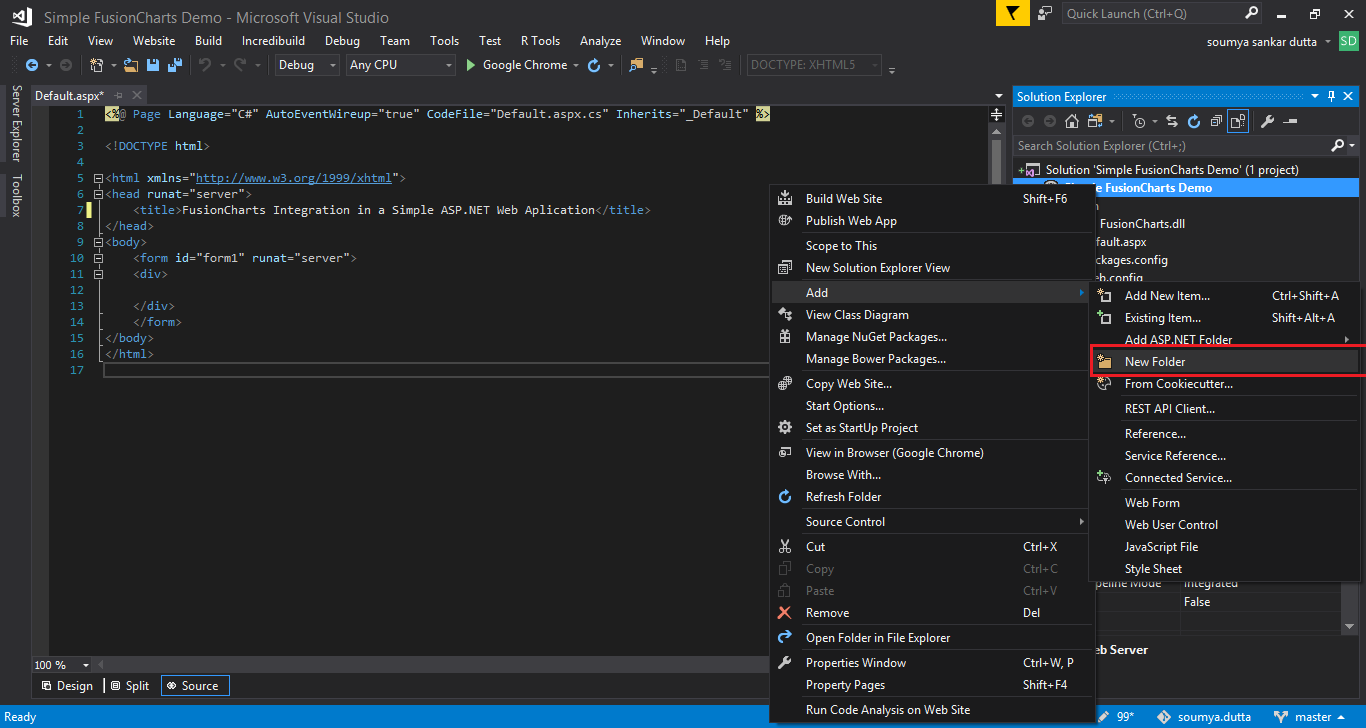
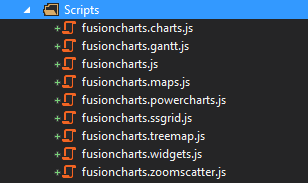
Step 8
Copy all the JavaScript files present in the JS folder of the FusionCharts package and paste them into the Scripts folder.
Step 9
Now we need to create a chart instance in the web app. To do this, add the following code in the Default.aspx file. This code will produce the interface for the app.
<%@ Page Language="C#" AutoEventWireup="true" CodeFile="Default.aspx.cs" Inherits="_Default" %>

<!DOCTYPE html>

<html xmlns="https://www.w3.org/1999/xhtml">
<head runat="server">
    <title>FusionCharts Integration in a Simple ASP.NET Web Aplication</title>
    <script src="Scripts/fusioncharts.js"></script>
    <script src="Scripts/fusioncharts.charts.js"></script>
</head>
<body>
    <form id="form1" runat="server">
   <asp:Literal ID="chart" runat="server"></asp:Literal>
    </form>
</body>
</html>
Step 10
Now we need to provide data for the chart to render. To do this, create the data.json file within the website hierarchy and add the following chart data source code in the file.
{
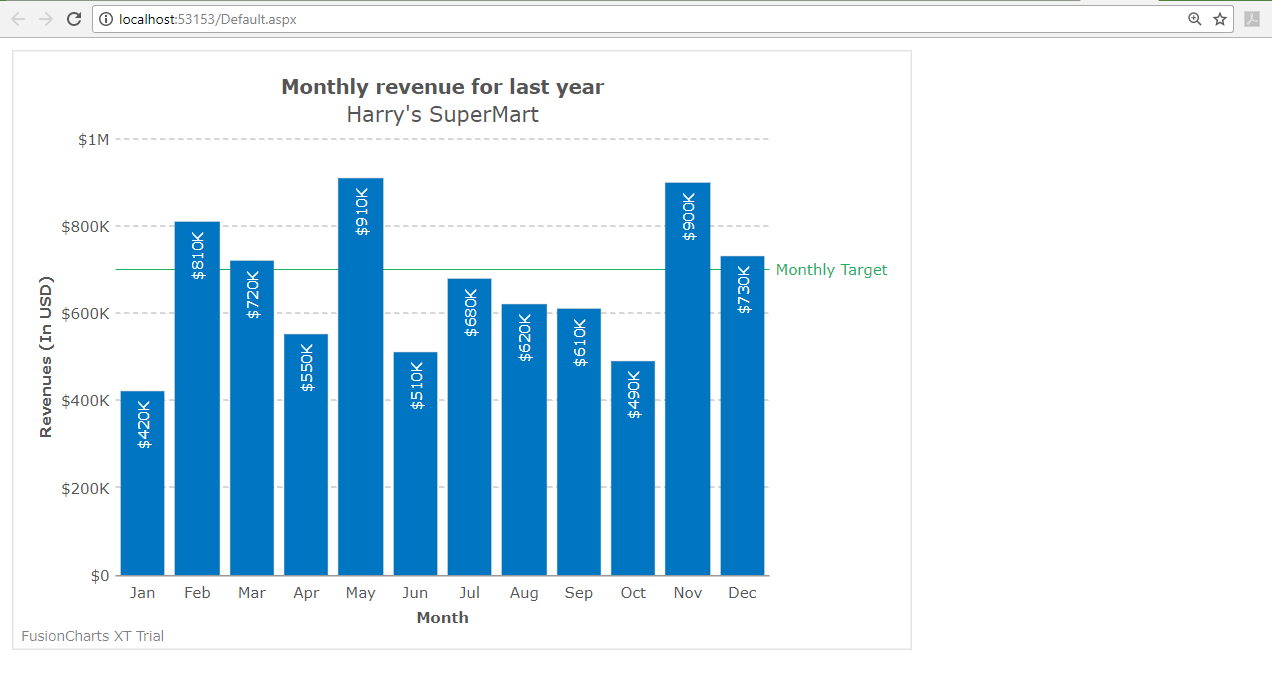
"chart": {
"caption": "Monthly revenue for last year",
"subCaption": "Harry's SuperMart",
"xAxisName": "Month",
"yAxisName": "Revenues (In USD)",
"numberPrefix": "$",
"paletteColors": "#0075c2",
"bgColor": "#ffffff",
"borderAlpha": "20",
"canvasBorderAlpha": "0",
"usePlotGradientColor": "0",
"plotBorderAlpha": "10",
"placevaluesInside": "1",
"rotatevalues": "1",
"valueFontColor": "#ffffff",
"showXAxisLine": "1",
"xAxisLineColor": "#999999",
"divlineColor": "#999999",
"divLineIsDashed": "1",
"showAlternateHGridColor": "0",
"subcaptionFontBold": "0",
"subcaptionFontSize": "14"
},
"data": [
{
"label": "Jan",
"value": "420000"
},
{
"label": "Feb",
"value": "810000"
},
{
"label": "Mar",
"value": "720000"
},
{
"label": "Apr",
"value": "550000"
},
{
"label": "May",
"value": "910000"
},
{
"label": "Jun",
"value": "510000"
},
{
"label": "Jul",
"value": "680000"
},
{
"label": "Aug",
"value": "620000"
},
{
"label": "Sep",
"value": "610000"
},
{
"label": "Oct",
"value": "490000"
},
{
"label": "Nov",
"value": "900000"
},
{
"label": "Dec",
"value": "730000"
}
],
"trendlines": [
{
"line": [
{
"startvalue": "700000",
"color": "#1aaf5d",
"valueOnRight": "1",
"displayvalue": "Monthly Target"
}
]
}
]
}
Step 11
Finally, we need to render the chart element. To do this, add the following code in the Default.aspx.cs file.
using System;
using System.Collections.Generic;
using System.Linq;
using System.Web;
using System.Web.UI;
using System.Web.UI.WebControls;
using FusionCharts.Charts;

public partial class _Default : System.Web.UI.Page
{
    protected void Page_Load(object sender, EventArgs e)
    {
        Chart newChart = new Chart("column2d", "simplechart", "600", "400", "jsonurl", "data.json");
        chart.Text = newChart.Render();
    }
}
Step 12
Now that all our code is in place, it is time to run the application. Press Ctrl + F5 to render the chart in the browser.
If you follow all steps correctly, your chart should display in your web app, similar to the image below:
If you are facing issues in rendering the chart or seeing any error in your code, you can download the complete source code of the project.
Moreover, you can also create charts in ASP.NET using the data stored in a database. We would love to know your thoughts on this; feel free to comment in the space below.