ASP.NET Plugin for FusionCharts
Interactive examples and Code Snippets
Features of the integration
Multiple data types
Insert charts from a JSON URL, an XML URL, or using Props Array Binding.
Add interactivity with ease
Enable interactivity between charts with hundreds of events and methods
Complete control over configurations
Enjoy advanced control with full access to FusionCharts object that contains complete chart configurations.
No need to write JavaScript code
Execute projects without writing separate API for your JavaScript application.
Directly connect to your database
Let it be SQL or NoSQL, connect your chart directly to database of your choice.
Build 100+ charts and 2000+ maps
Go beyond column charts and pie charts with our 100+ charts made for any kind of data. From area to donut and marimekko to radar, we’ve got all your charting needs covered. Don’t just stop at charts, with 2000+ maps, gauges and more, your dashboards and reports will become more meaningful and insightful.
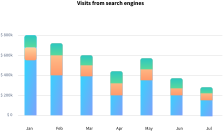
Chart Gallery
Explore 100+ charts for your React application
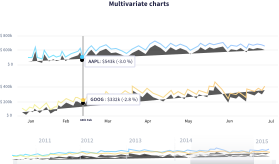
Time Series Gallery
Explore how to plot millions of data on a time-series chart in React
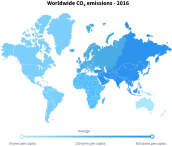
Maps Gallery
Render 2000+ Maps for your React project
