Everyone knows the saying “A picture speaks a thousand words!” While it may be a cliche, it is also very true. Having effective and beautiful presentations, especially in a business environment is the key to communicating ideas and convincing people.
If you are looking for an advantage over the competition or your peers, the FusionCharts platform is the number one choice. It is perfect for any manager, executive or data scientist when it comes to charting statistics and plotting data. Whether you are designing a presentation, drafting a marketing strategy, preparing a financial report or creating a business plan, you can rely on FusionCharts for the best charts, maps and graphs as a means of conveying your thoughts.
Along with FusionCharts, FusionExport is a library that is easily integrated into your software app to exporting charts, maps and graphs. Developers can use their programming language of choice to quickly call FusionExport APIs to export dashboards and visuals as high-quality digital images or PDF files. You can easily export live dashboards, then downloaded and save them for emailing as well embedding in other applications.
If this interests you, then read on to find out how you can export beautiful business dashboards created by FusionCharts in Node.js by using FusionExport. In this blog, we’ll export the following dashboard by calling the FusionExport’s APIs in Node.js. The data for this dashboard is from the UCI Machine learning repository and shows the number of patients entering the medical emergency services in one month. The dashboard includes a 2D column chart, area graph, and doughnut chart as well as a line plot.
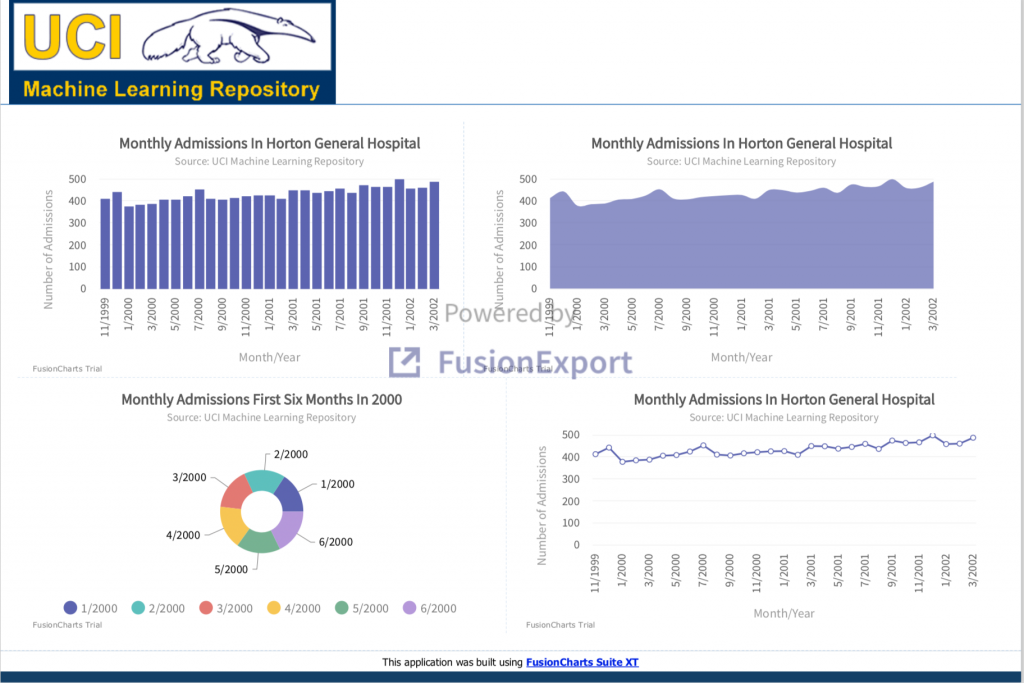
Table of Contents
What is FusionExport?
You can download FusionExport as a binary file that runs on your server. The FusionExport SDK allows you to call the FusionExport services from within your app. Alternatively, you can call FusionExport API’s endpoints directly. The SDK is available for different languages like Node.js, Python, and Java, as well as PHP.
What Are the Steps For Exporting Dashboards in Node.js?
Here are the steps for exporting dashboards using FusionExport from Node.js, assuming that you have already installed Node.js on your system.
Step 1: Download and Run FusionExport Server
Click this link to download the FusionExport Server for your OS. Follow the steps to install the server on your machine. Once you have installed the server, run it by typing at the console (change YOUR_PATH to the path of the installed server):
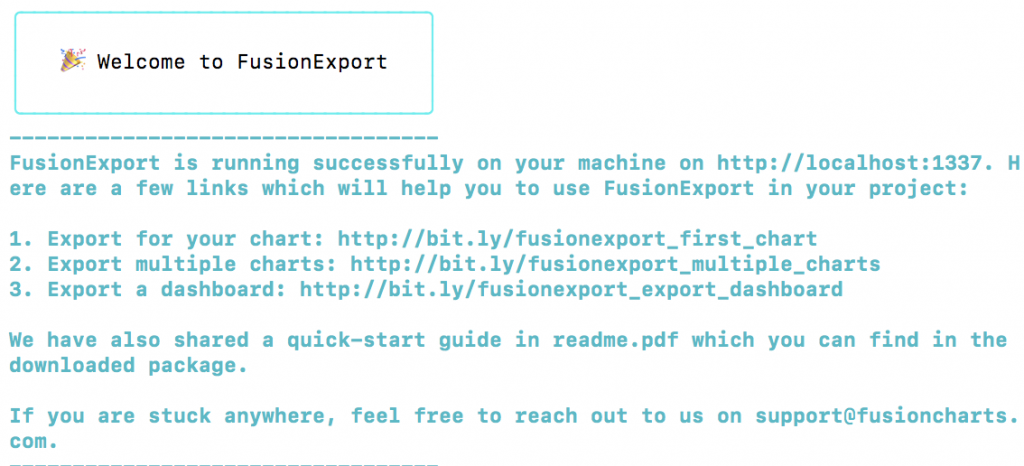
YOUR_PATH/fusionexportWhen the server runs, you’ll see the following screen:
Step 2: Install SDK for Node.js
Use npm to install the FusionExport SDK for Node.js as:
npm install fusionexport-node-client --saveStep 3: Create Configuration File For Dashboard
Create a project directory called fusion-charts-export-node-js. In this folder create a resources folder and add the file dash-config-file.json to the resources folder. This file contains the configuration of the dashboard as JSON. Paste the following code in this file. Note, this is just the configuration and has no data field. We’ll add the data key later via code.
[
  {
    "type": "column2d",
    "renderAt": "chart-container",
    "width": "500",
    "height": "300",
    "dataFormat": "json",
    "dataSource": {
      "chart": {
        "caption": "Monthly Admissions In Horton General Hospital",
        "subcaption": "Source: UCI Machine Learning Repository",
        "xaxisname": "Month/Year",
        "yaxisname": "Number of Admissions",
        "showvalues": "0",
        "theme": "fusion"
    }
  }
},
  {
    "type": "splinearea",
    "renderAt": "area-chart-container",
    "width": "550",
    "height": "300",
    "dataFormat": "json",
    "dataSource": {
      "chart": {
        "caption": "Monthly Admissions In Horton General Hospital",
        "subcaption": "Source: UCI Machine Learning Repository",
        "xaxisname": "Month/Year",
        "yaxisname": "Number of Admissions",
        "showvalues": "0",
        "theme": "fusion"
      }
    }
  },
  {
    "type": "doughnut2d",
    "renderAt": "pie-chart-container",
    "width": "550",
    "height": "300",
    "dataFormat": "json",
    "dataSource": {
      "chart": {
        "caption": "Monthly Admissions First Six Months In 2000",
        "subcaption": "Source: UCI Machine Learning Repository",
        "xaxisname": "Month/Year",
        "yaxisname": "Number of Admissions",
        "showvalues": "0",
        "theme": "fusion"
      }
    }
  },
  {
    "type": "line",
    "renderAt": "line-chart-container",
    "width": "550",
    "height": "300",
    "dataFormat": "json",
    "dataSource": {
      "chart": {
        "caption": "Monthly Admissions In Horton General Hospital",
        "subcaption": "Source: UCI Machine Learning Repository",
        "xaxisname": "Month/Year",
        "yaxisname": "Number of Admissions",
        "yaxismaxvalue": "5",
        "showvalues": "0",
        "theme": "fusion"
      }
    }
  }
]
Step 4: Create Dashboard Template
In the resources folder, create a dashboard-template.html file. Paste the following code to it. You need this to style your dashboard.
<html>
<head>
    <title>Exporting FusionCharts in Node.js</title>
    <style>
          body {
        margin: 0;
        padding: 0;
        width: 100%;

        background-color: #00406a;
        font-family: Tahoma, Helvetica, Arial, sans-serif;
      }

      h1,
      h2,
      h3,
      h4,
      h5 {

        margin: 0;
        padding: 0;
        font-weight: bold;
        text-align: center;
      }

      .chartCont {
        padding: 0px 12px;
      }

      .border-bottom {
        border-bottom: 1px dashed rgba(0, 117, 194, 0.2);
      }

      .border-right {
        border-right: 1px dashed rgba(0, 117, 194, 0.2);
      }

      #container {
        width: 1200px;
        margin: 0 auto;
        position: relative;
      }

      #container > div {
        width: 100%;
        background-color: #ffffff;
      }

      #logoContainer {
        float: left;
      }

      #logoContainer img {
        padding: 0 10px;
      }

      #logoContainer div {
        position: absolute;
        top: 8px;
        left: 95px;
      }

      #logoContainer div h2 {
        color: #0075c2;
      }

      #logoContainer div h4 {
        color: #0e948c;
      }

      #logoContainer div p {
        color: #719146;
        font-size: 12px;
        padding: 5px 0;
      }

      #userDetail {
        float: right;
      }

      #userDetail img {
        position: absolute;
        top: 16px;
        right: 130px;
      }

      #userDetail div {
        position: absolute;
        top: 15px;
        right: 20px;
        font-size: 14px;
        font-weight: bold;
        color: #0075c2;
      }

      #userDetail div p {
        margin: 0;
      }

      #userDetail div p:nth-child(2) {
        color: #0e948c;
      }

      #header div:nth-child(3) {
        clear: both;
        border-bottom: 1px solid #0075c2;
      }

      #content div {
        display: inline-block;
      }

      #content > div {
        margin: 0px 20px;
      }

      #content > div:nth-child(1) > div {
        margin: 20px 0 0;
      }

      #content > div:nth-child(2) > div {
        margin: 0 0 20px;
      }

      #footer p {
        margin: 0;
        font-size: 9pt;
        color: black;
        padding: 5px 0;
        text-align: center;
      }
    </style>
</head>

<body>
<div id="container">
    <div id="header">
        <div id="logoContainer">
            <img
                    src="https://archive.ics.uci.edu/ml/assets/logo.gif"
                    alt="Logo"
            />
            <div>
                <h2></h2>

                <h4></h4>
            </div>
        </div>
        <div id="userDetail">
        </div>
        <div></div>
    </div>
    <div class="border-bottom" id="content">
        <div class="border-bottom">
            <div class="chartCont border-right" id="chart-container">
                FusionCharts will load here.
            </div>
            <div class="chartCont" id="area-chart-container">
                FusionCharts will load here.
            </div>
        </div>
        <div>
            <div class="chartCont border-right" id="pie-chart-container">
                FusionCharts will load here.
            </div>
            <div class="chartCont" id="line-chart-container">
                FusionCharts will load here.
            </div>
        </div>
    </div>
    <div id="footer">
        <p>
            This application was built using
            <a
                    href="https://www.fusioncharts.com"
                    target="_blank"
                    title="FusionCharts - Data to delight... in minutes"
            ><b>FusionCharts Suite XT</b></a
            >
        </p>
    </div>
</div>
</body>
</html>
Step 5: Read Data and Call FusionExport
Create the code file exportDashboard.js. We’ll read the data from the HortonGeneralHospital.csv file in the UCI machine learning repository. The first few lines of the data are shown below:
"1",1,0,0,413,1999,11
"2",1,0,0,443,1999,12
"3",1,0,0,378,2000,1
"4",0,0,0,385,2000,2
The 6th and 7th columns show the year and month. The 5th column is the admissions column that shows the count of people entering the emergency. We’ll construct the data JSON object with label keys as month/year and the value as the number of admissions.
The exportDashboard.js file implements the following steps:
- Import the FusionExport SDK client for node.js.
- Fetch the data from the UCI ML repository.
- Construct the data JSON object.
- Read the configuration from dash-config-file.JSON and set the data JSON in the dataSource for each chart object.
- Create the ExportConfig and ExportManager objects and export the data.
Insert the following code in exportDashboard.js file:
// Import 'path' and 'fs' core module of Node.js
const path = require('path');
const fs = require('fs');
const fetch = require('node-fetch');
const https = require('https');

// Import FusionExport SDK client for Node.js
const {
    ExportManager,
    ExportConfig
} = require('fusionexport-node-client');


uciRepo = 'https://archive.ics.uci.edu/ml/machine-learning-databases/00549/HortonGeneralHospital.csv';

let txt = []

// Fetch the data from UCI ML Repo
async function readUciData(){
    return await fetch(uciRepo)
    .then(res => res.text())
}

// Convert the downloaded data into JSON
async function getData(){
    txt = await readUciData();
    var data = [];
    var rows = txt.split("\n");
    //Get only the first 30 rows
    for(var i=1;i<30;i++) {
        var cols = rows[i].split(',');
        var obj = {label:cols[6].concat('/', cols[5]), value:cols[4]}
        data.push(obj);
    }
    return data;
}


async function exportDash() {

  // Get the data JSON
  data = await getData();

  // Read the configurations for the dashboard
  let jsonStr = fs.readFileSync("resources/dash-config-file.json", "utf8");
  let fcConfig = JSON.parse(jsonStr);

  // Set the data object in charts read in fcConfig var
  for (var i=0;i<fcConfig.length;++i) {
    //special case for doughnut chart
    if (i==2) {
      doughnut = [];
      for (var j=2;j<8;++j)
          doughnut.push(data[j]);
      fcConfig[i].dataSource["data"] = doughnut
    }
    else
      fcConfig[i].dataSource["data"] = data;
  }
  // --- EXPORT CONFIG ---
  // Instantiate ExportConfig
  const exportConfig = new ExportConfig();
  exportConfig.set('chartConfig', fcConfig);
  exportConfig.set('templateFilePath', path.join('resources', 'dashboard-template.html'));

  // --- EXPORT-MANAGER ---
  // Instantiate ExportManager
  const exportManager = new ExportManager();

  // --- OUTPUT ---
  // Export the chart
  exportManager.export(exportConfig, outputDir = '.', unzip = true).then((exportedFiles) => {
    exportedFiles.forEach(file => console.log(file));
  }).catch((err) => {
    console.log(err);
  });
}

exportDash();
How Do I Run The Code?
To run the code, at the console type:
node exportDashboard.jsOnce the code runs, you’ll see the export.pdf file in the code directory.
That’s it! We just exported a dashboard as PDF in 5 easy steps.
Head over and download the full source code for this Javascript dashboard.
Are There More Options For Exporting Dashboards and Charts?
FusionExport includes SDK for Python, C#, Java, PHP, and many more. It works with all Javascript Charting libraries such as FusionCharts, HighCharts, d3, and chart.js. You can download the live state of your dashboards and add your brand or company logo to it for further emailing or embedding in presentations.
Don’t wait. Start your free trial for FusionExport today!
