FusionCharts is the go-to charting API for JS developers that need to quickly and easily create and edit interactive charts on an enterprise dashboard. in addition to being easy to use, its three overlapping products provide cross-browser support. To clarify, these three products are FusionChart Suite, FusionTime, and FusionExport, each of which we will discuss in this article.
Table of Contents
What can you do with FusionCharts libraries?
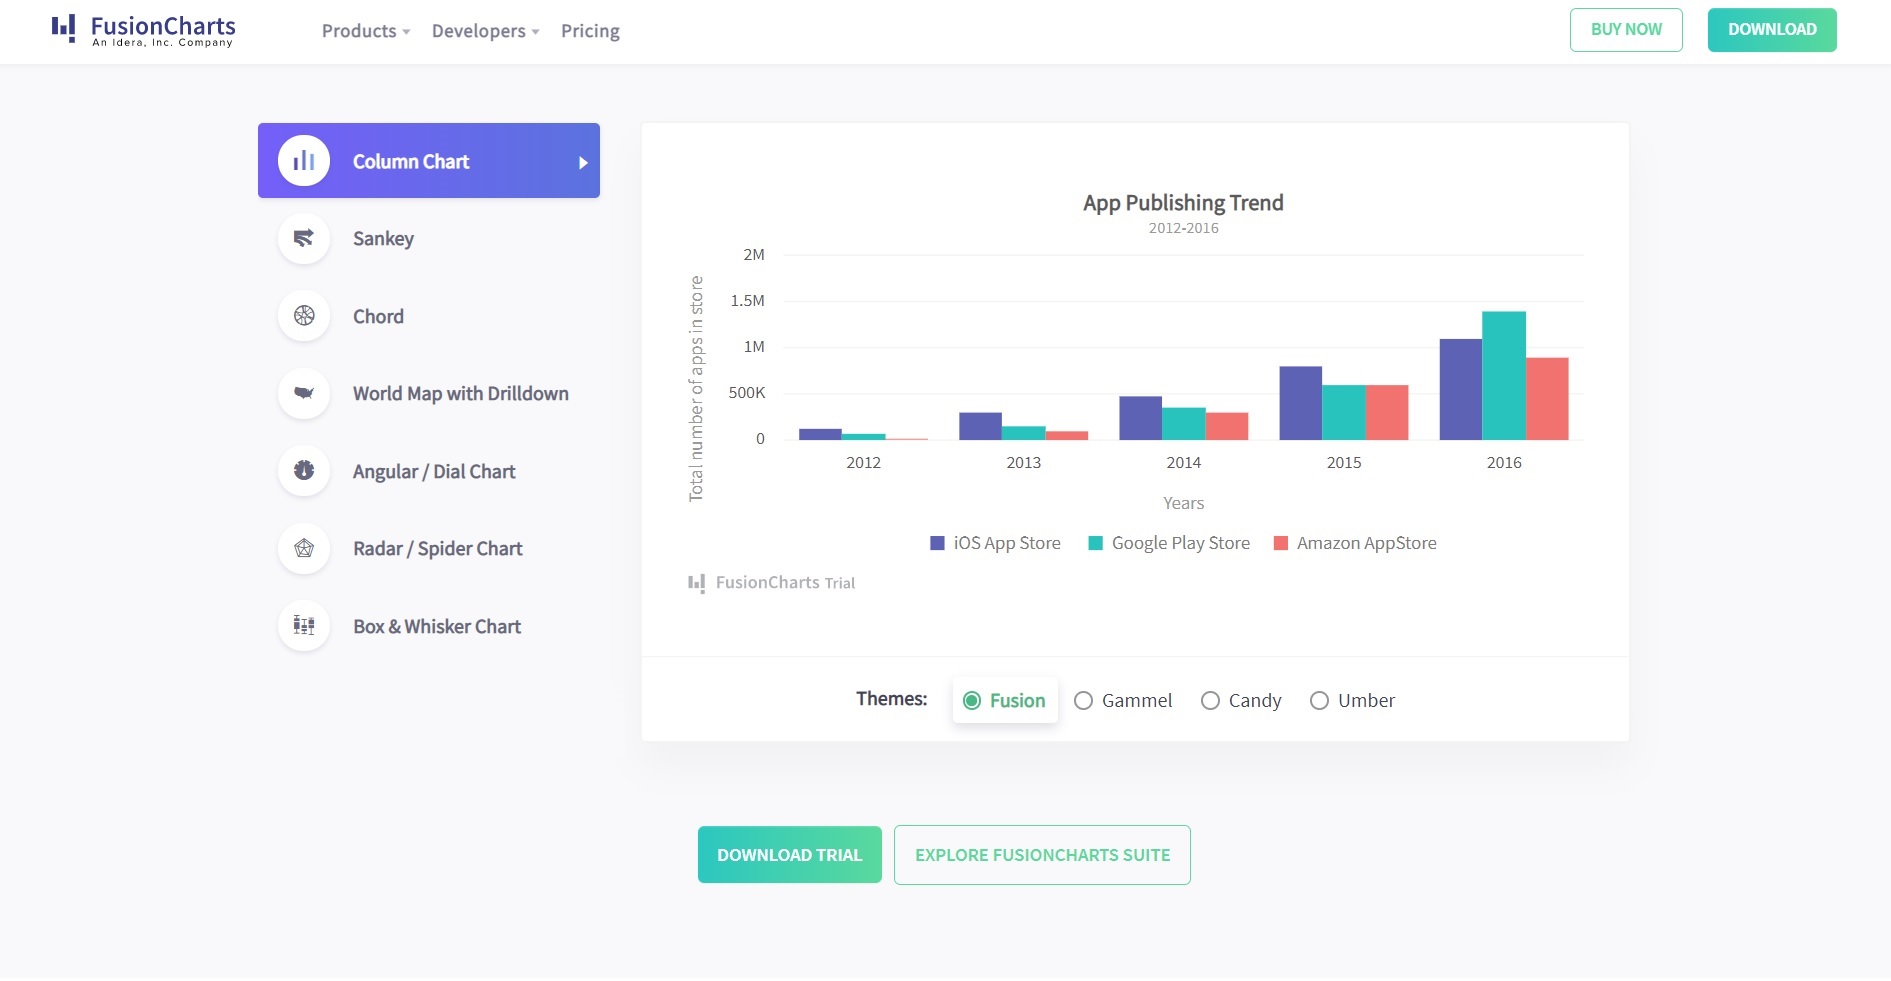
You can do many things with FusionCharts. For example, FusionCharts libraries are filled with templates of widely-used chart formats. These include bar graphs, line plots, pie charts, and domain-specific chart types that range from Treemaps to Waterfall layouts. In addition to this, FusionCharts currently contains well over 2000 choropleth maps that span many countries and locations.
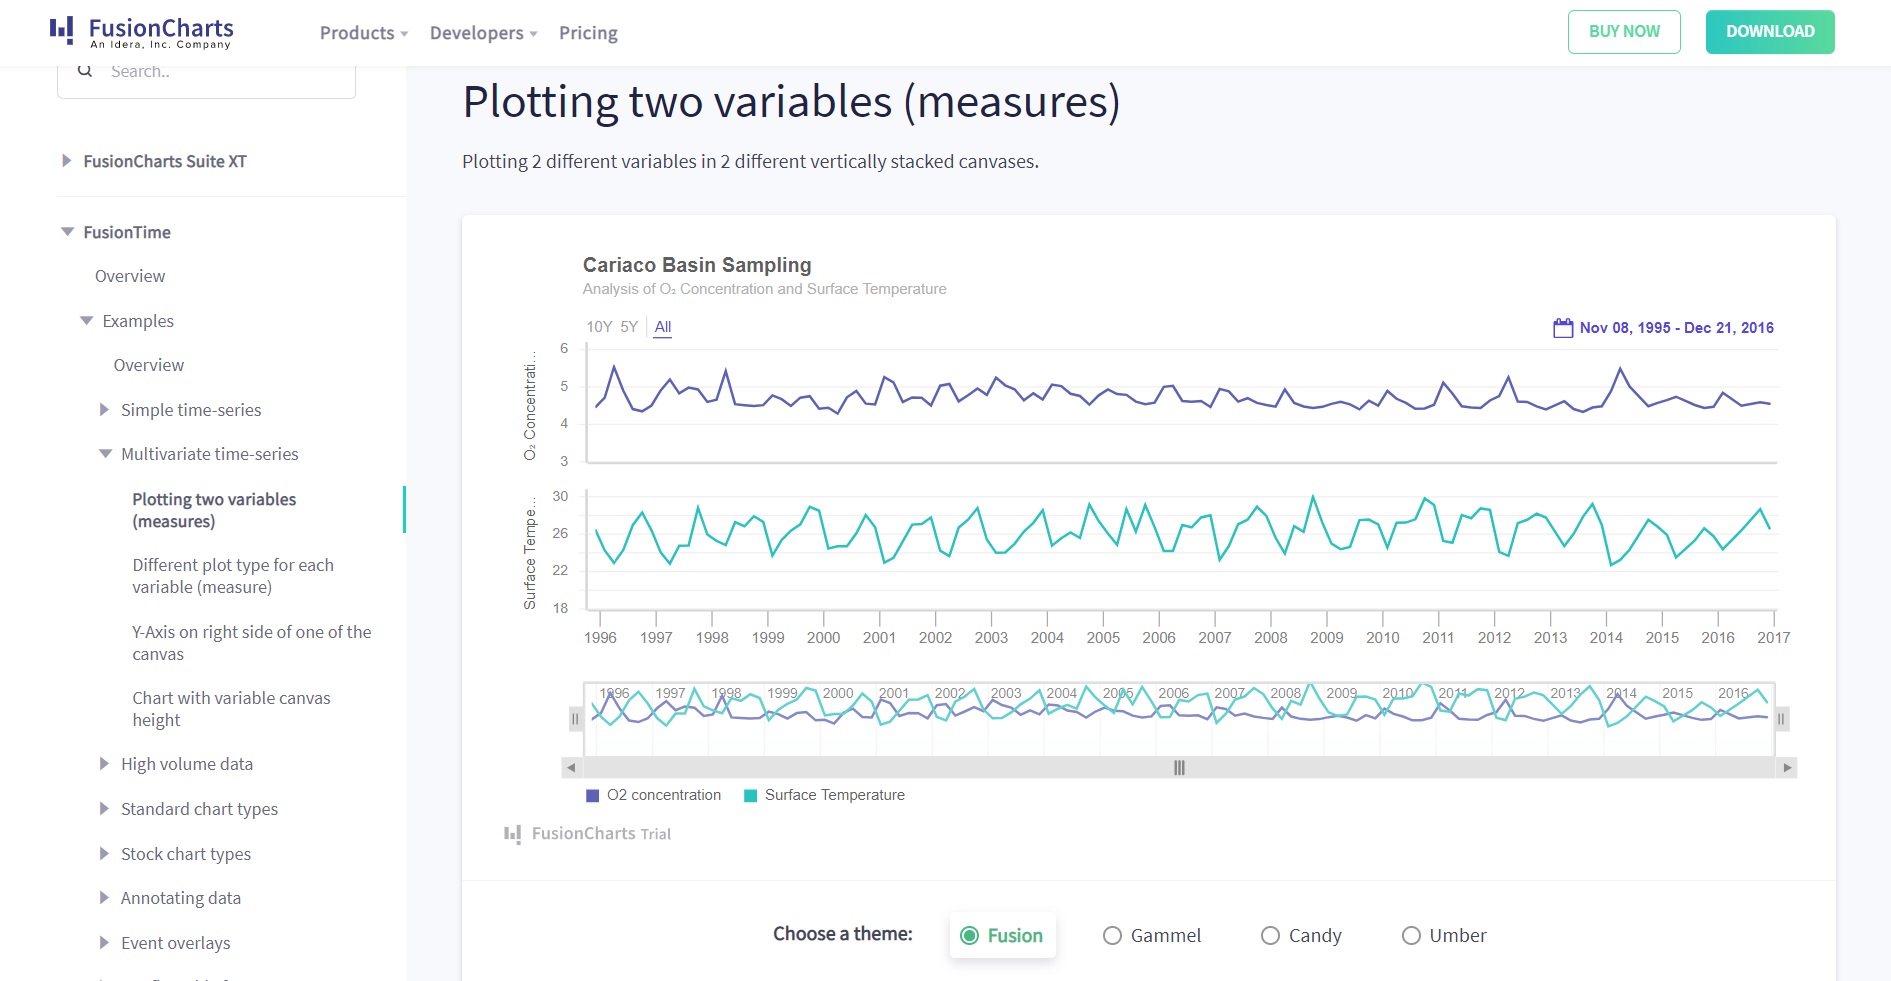
As a simple example, if you want to measure the steady growth in sales of your products over time or identify large sets of entries collected from your app users, then FusionCharts’ time-series chart has the tools to help you visualize them all at once on your browser. Suffice to say it is a powerful data visualization tool.
Here is a quick rundown of what each FusionCharts offering does:
FusionCharts Suite – This API gives you access to hundreds of charts and thousands of maps to explore. Because of this, you can upload complex reports using all kinds of creative widgets. You have the freedom to design custom dashboards for any web project and top it off with a variety of precise charted statistics.
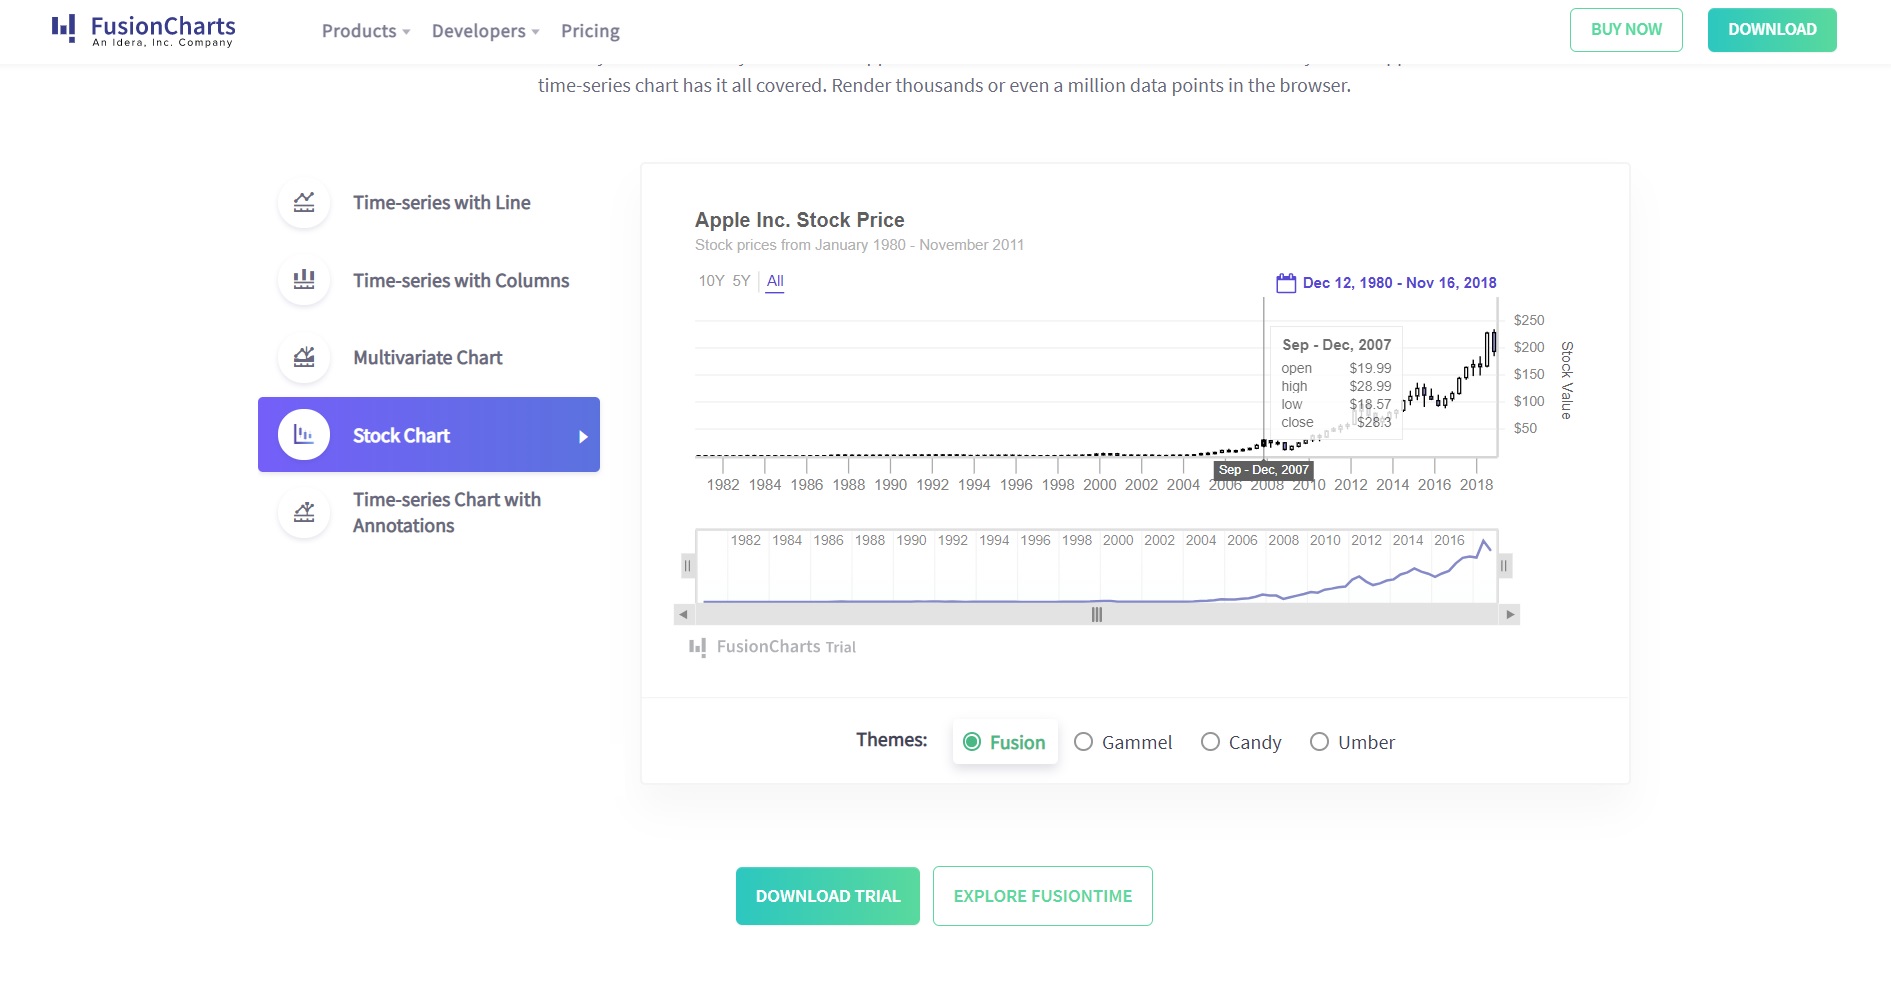
FusionTime – This is a high-performance time-series API. It is meant for labeling stock data for users in charge of tracking business-oriented financial data. With only a few lines of code, you’ll be able to create interactive time-series or stock market charts with the potential to store millions of data points. FusionTime is perfect for plotting OHLC, candlestick, and column variants.
FusionExport – The FusionExport extension lets you export a working dashboard into other formats like a PDF or image file. This makes it easy to generate live dashboards on the server without having to download them individually. FusionExport has the benefit of being compatible with other JS libraries including FusionCharts, HighCharts, d3, and Chart.js.
What are open-source charting libraries?
In most open source charting libraries, JavaScript spearheads most of the front-end scripting. It is one of the best languages for displaying responsive charts with clear-cut visualization tools. If you’re curious and want to explore alternatives to FusionCharts, there are plenty of no-cost open-source charting libraries out there.
You might have heard of the classic Chart.js, which renders HTML5 on a dynamic canvas. It provides hoverable tooltips and clickable events to guide its users. It is also suitable for linear graphs and scatter charts alike. Another common charting library is Apexcharts.js. This library features advanced visualizations through data-driven maps, meter gauges, and front-end integrations on Angular, React, or jQuery. Apexcharts also provides a lot of documentation describing its different templates.
While they may be free, these libraries have a deep learning curve. They usually require days of learning before you can even build your first chart — then configuring them to suit your requirements is another story!
Many libraries do not provide a consistent look and feel across their charts. This problem gets even worse when you use multiple libraries. Sadly, few libraries officially support plugins for your frameworks and back-end languages.
Commonly, these libraries have simple tutorials that help you get started, but beyond that, you’re expected to jump straight into API docs or even source code without the benefit of clear examples. These libraries do showcase their individual charts and features, but most of them don’t provide examples of how to create an integrated dashboarding experience.
Why choose Fusioncharts over free, open-source libraries?
Below is a roundup of reasons that explain why going with a free, open-source library over FusionCharts may be a false economy when it comes to building your dashboards. The examples below show you what FusionCharts offers and where the others fall short.
FusionCharts is Easier to Use
- Plot high-performance charts for Big Data applications on Time-series, Multivariate, or Stock values
- Trusted by developers from over 28,000 companies from Google to IBM
- Few barriers to entry on uploading your first chart
- Easy to set up your dashboard or a new theme with consistent visuals
Integrations
- Compatible with JavaScript, CDNs, or NPM managers
- Available documentation on each programming language is attached with live examples
- Ready-to-use charts tailored to specific industries, compiled on an aggregate list from the library itself
- Automatic configurations that adjust the default settings and find the best method for displaying your charts
Features
- Time navigation scaled to your project scope without worrying about bugs
- Effortlessly export your charts to the server or send your reports through email
- Supports older browsers and positions elements to match your device size
- Receives frequent updates from an active development team to focus on customer-driven priorities
- Live chat and personalized help whenever you need it
- Flexible pricing plans and licensing options if you have a smaller team
What are the limitations of Open Source charting libraries?
Open source charting libraries may be free but sometimes you get what you pay for. They can suffer from recurring issues, have trouble charting your data and offer inconsistent (or no) documentation. They can also fall short in some areas, such as having inconsistent visuals on the front end.
Recurring Issues
- Instructions are unclear or disjointed–less beginner-friendly for chart building
- May not support all frameworks because fewer libraries can operate alongside your plugins
- API documentation and source code pages may be difficult to comprehend without proper demos in place
- May not have previews of navigating the dashboard, forcing the user to test features themselves
- You are responsible for calling the shots on default configurations
- May not have a release roadmap, thereby causing delays in your project timelines
Trouble with Charting
- Smaller capacity for storing charts, requiring you to install multiple libraries to find a suitable chart
- Time-series plots may also lack UX elements to label and identify key indicators
- Chart exports are likely to result in missing data or unfit layouts, especially for printing
- Product may only work on modern browsers, possibly raising errors on older versions
- Must rely on online communities to assist you with technical problems
With open-source libraries, there is no commitment for future bug fixes or feature additions. This can delay or leave your project timelines open-ended. In addition, with open source libraries there is no single point to get support. While you are working to meet a deadline, it’s risky to expect on-demand support from an online community. For this reason, you should always consult the documentation before selecting an open-source charting library, whether you plan on getting FusionCharts or another product.
Ready to build a dashboard for desktop or mobile?
All said, there are over 800,000 developers from 28,000+ companies who prefer FusionCharts products over open source or other paid libraries. If you want to get all the variations of popular charts like Bar, Column, Line, Area, and Pie; or domain-specific charts like Treemaps, Heatmaps, Gantt Charts, Marimekko Charts, Gauges, Spider Charts, Waterfall Charts, and many more, then FusionCharts is is the way forward. In addition to charts, we also have over 2000+ choropleth maps which cover countries, counties and also cities!
Head over to FusionCharts to start working with our powerful charting libraries today!