The exchange rate of cryptocurrency and its forecasted values are important in many domains of the financial and corporate world. Whether you own a small business, a startup, or a large corporation, keeping tabs on the market prices of digital currencies and understanding their trend now plays an essential role in future plans and decisions. To this end, there is an increasing interest in the Ethereum blockchain network that facilitates the development of decentralized applications and supports smart contracts. Its digital currency, Ether (ETH) is growing in popularity.
Table of Contents
Exploring Digital Currencies
To understand the market prices of digital currencies, having a trusted service for retrieving exchange rates is of paramount importance. Coinlayer is a platform that provides reliable, cost-effective, and easy access to real-time and historic digital currency exchange rates including ETH. It is a valuable resource for any data analyst or financial investigator.
Along with a reliable and trusted exchange rate server, automated tools for plotting, illustrating, and graphing this data are also required. FusionCharts is a smart choice for a data visualization tool when it comes to deciding on the platform for creating beautiful charts and illustrations. It supports the development of both web and mobile applications and is accompanied by extensive documentation and easy-to-use APIs to create beautiful charts for visualizing all kinds of data.
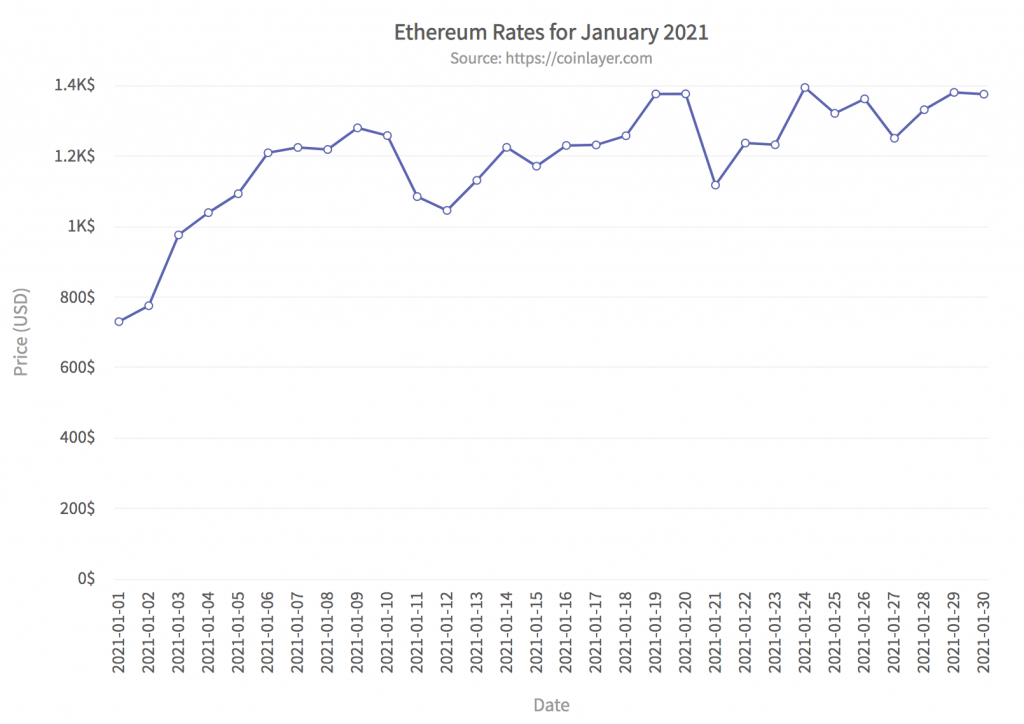
We invite you to keep reading to discover how you can use FusionCharts to plot historic ETH prices retrieved using Coinlayer’s APIs in the Python programming language using Django. In this blog, we’ll create a line chart of the ETH prices for January 2021. The graph is illustrated below:
What is Coinlayer?
Coinlayer is a platform that provides accurate information on digital currency values and physical currency exchange rates via its APIs. You can register for a free account and get access to 500 requests per month. Here is an example HTTP query for retrieving the value of ETH for January 01, 2021. You have to replace YOUR_KEY with your registered access key.
https://api.coinlayer.com/2021-01-01?access_key=YOUR_KEY&symbols=ETHThe response is a JSON string:
{'success': True,
 'terms': 'https://coinlayer.com/terms',
 'privacy': 'https://coinlayer.com/privacy',
 'timestamp': 1609631947,
 'target': 'USD',
 'historical': True,
 'date': '2021-01-01',
 'rates': {'ETH': 730.013552}}
What Are the Steps to Create a Historical Ethereum Chart?
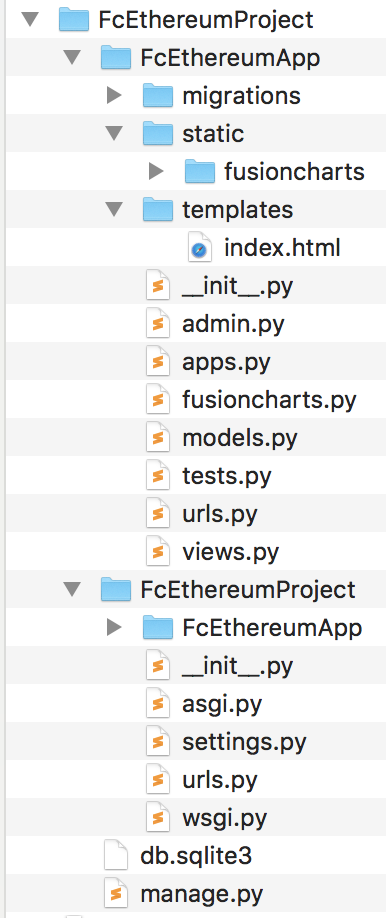
Here we outline 5 easy steps for creating a Django project that calls the Coinlayer API and renders a line chart using FusionCharts. It is assumed that you already have Python and Django environments set up on your computer. We’ll create a project directory called FcEthereumProject. After completing steps 1-4, you should see the following structure of the project directory:
Step 1: Create a Project Called FcEthereumProject
Create a Django project by typing the following at the command prompt:
django-admin startproject FcEthereumProjectAt the console change to the project directory and create a Django App called FcEthereumApp by typing the following commands:
cd FcEthereumProject
python manage.py startapp FcEthereumApp
Step 2: Add FusionCharts Components
Download fusioncharts-suite-xt for Django from the FusionCharts download page. Complete the following three steps to add FusionCharts components to the Django project:
Step 2.1: Add fusioncharts.py
Locate the fusioncharts.py file in the downloaded folder at location fusioncharts-suite-xt/Integrations/django/fusioncharts-wrapper folder and paste it into FcEthereumApp folder. You can refer to the directory structure shown in the above figure.
Step 2.2: Add static/fusioncharts Folder
Create a static/fusioncharts folder in the FcEthereumApp folder and copy all the files from the downloaded fusioncharts-suite-xt/js to this folder. Again, you can consult the directory hierarchy shown in the figure.
Step 2.3: Create index.html File
Create a templates folder in FcEthereumApp and place an index.html file there. The index.html file has the import sections for the FusionCharts library and contains the div tag for the chart container. Copy the following contents to the index.html file:
<!DOCTYPE html>
<html>
<head>
    <title>Historical Ethereum Rates Chart</title>
    {% load static %}
    <script type="text/javascript" src="{% static "fusioncharts/fusioncharts.js" %}"></script>
    <script type="text/javascript" src="{% static "fusioncharts/fusioncharts.charts.js" %}"></script>
    <script type="text/javascript" src="{% static "fusioncharts/themes/fusioncharts.theme.fusion.js" %}"></script>
    </head>
    <body>
        <div id="chart-container">{{ output|safe }}</div>
    </body>
</html>
Step 3: Adjust Project Settings
Now it’s time to adjust the project settings.
Step 3.1: Update the settings.py File
Open the FcEthereumProject/settings.py file and add the name of the Django app, i.e., ‘FcEthereumApp’ in the ‘INSTALLED_APPS’ section.
Add the following to the template section of the settings.py file:
'DIRS': ['FcEthereumProject/FcEthereumApp/templates'],Create a new variable STATIC_ROOT in the same settings.py file. The variable holds the path of the static folder:
STATIC_ROOT = "FcEthereumProject/FcEthereumApp/static"Step 3.2: Collect Static Files
At the console type:
python manage.py collectstaticStep 4: Add the URLs
You need to follow two steps for adding URLs.
Step 4.1: In Apps Folder
In the FcEthereumApp folder create a file urls.py and paste the following contents in this file:
from django.contrib import admin
from django.urls import path
from . import views

urlpatterns = [
   path('', views.renderChart, name="demo"),
]
Step 4.2: In the Project Folder
In the FcEthereumProject there is already a urls.py file. You can overwrite the contents of this file with the following:
from django.contrib import admin
from django.urls import path, include

urlpatterns = [
    path('admin/', admin.site.urls),
    path('', include('FcEthereumApp.urls'))
]
Step 5: Add the Code for Calling Coinlayer API and Rendering the Chart
Open views.py file located in the FcEthereumApp folder and add the code for calling Coinlayer API and creating the FusionCharts line chart.
import json
import requests
from django.shortcuts import render
from django.http import HttpResponse
from collections import OrderedDict

# Add your access key for coinlayer
ACCESS_KEY = 'YOUR_KEY'

# Include the `fusioncharts.py` file that contains functions to embed the charts.
from .fusioncharts import FusionCharts

# Call the coinlayer API and get the rates and return the array of key-value pairs
# Key is label and value is the ETH price
def get_data_arr():
  json_data_arr = []
  for i in range(31):
      # Construct the query
      date = '2021-01-'+ '{:02d}'.format(i+1)
      query = 'https://api.coinlayer.com/' + date
      query += '?access_key=' + ACCESS_KEY
      query += '&symbols=ETH'
      # Get the response
      response = requests.get(query)
      # Check if response is OK
      if response.status_code != 200:
        return [{'label': 'error', 'value': 0}]
      # Status is OK
      data = response.json()
      obj = {'label': date, 'value': data['rates']['ETH']}
      json_data_arr.append(obj)
  return json_data_arr

def renderChart(request):
  # The `chartConfig` dict contains key-value pairs of data for chart attribute
  chartConfig = OrderedDict()
  chartConfig["caption"] = "Ethereum Rates for January 2021"
  chartConfig["subCaption"] = "Source:  https://coinlayer.com"
  chartConfig["xAxisName"] = "Date"
  chartConfig["yAxisName"] = "Price (USD)"
  chartConfig["numberSuffix"] = "$"
  chartConfig["theme"] = "fusion"
# Chart data is passed to the `dataSource` parameter, like a dictionary in the form of key-value pairs.
  dataSource = OrderedDict()
  dataSource["chart"] = chartConfig
  dataSource["data"] = get_data_arr()


# Create an object for the line chart using the FusionCharts class constructor
# The chart data is passed to the `dataSource` parameter.
  line_chart = FusionCharts("line", "Historical-Ethereum", "800", "600", "chart-container", "json", dataSource)
  return render(request, 'index.html', {
    'output': line_chart.render()
})
In the above code, the get_data_arr() function constructs the Coinlayer API query and fetches the historical ETH prices for the 31 days of January 2021. The renderChart function renders the line chart.
How Do I Run the Django App?
At the console type:
python manage.py runserverYou can view the chart in your browser at: https://127.0.0.1:8000/
That’s it. We just created a Django App that renders a FusionCharts line chart by integrating Coinlayer’s APIs for retrieving ETH historical rates of January 2021.
You can download the full source code for this app and try it out.
Are There More Ways to Plot Financial Data?
FusionCharts offers not only 100+ graphs, charts, and gauges but also 2000+ choices for choropleth maps. Whether you are a data scientist, a marketing analyst, or a business manager, FusionCharts is a valuable tool for you for visualizing and presenting financial data.
Get started today and download your free FusionCharts trial.
