We are living in a digital age, where enormous volumes of data are being produced every second of the day. With data comes information and valuable insights along with guides for important future decisions. Unfortunately, plain raw numbers when viewed in a spreadsheet make little or no sense to us. This has led to an increased dependency on data visualization tools and apps that present data graphically and make it easy for us to gain important insights.
When you start exploring the market for data visualization tools, you’ll come across many options. While many of them might be OK for basic data plotting, most of them will fail on account of either quality, presentation or higher costs. Here, we have put together a guide that will show you how to save money on a Highcharts alternative that is not only cost-effective but also gives you the reliability and high grade presentations that you are looking for.
Table of Contents
Why is FusionCharts a Great Highcharts Alternative?
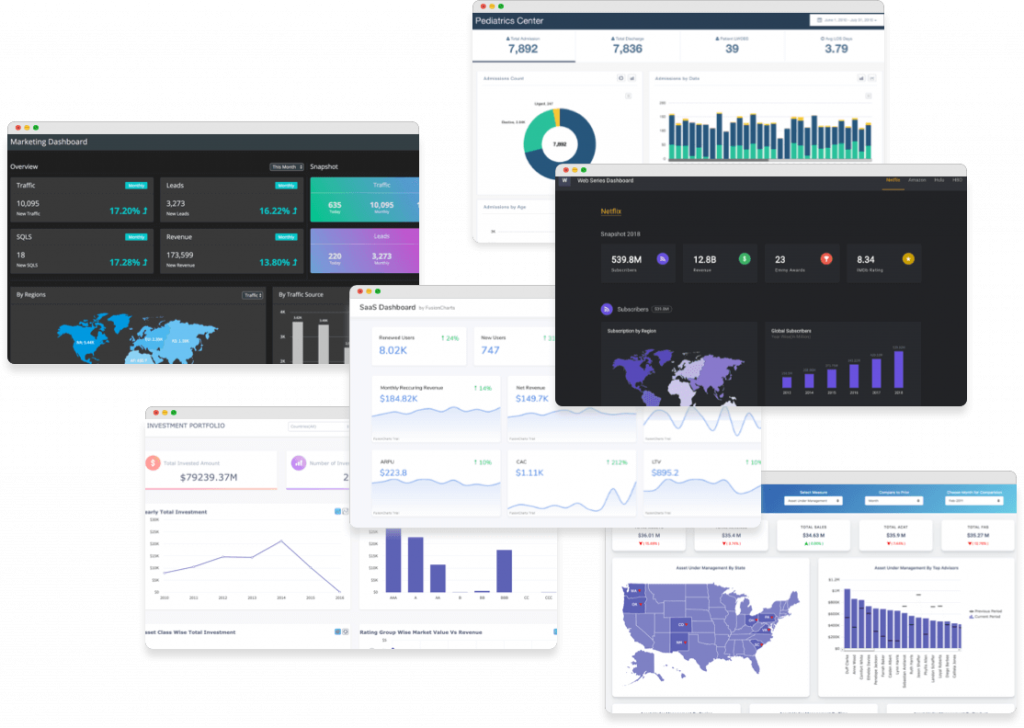
FusionCharts is a great Highcharts alternative, which is not only low priced and cost-effective but also provides beautiful data representations. If you want to enhance your users’ data visualization experience with stunning and awesome charts, graphs, gauges and maps, then go for FusionCharts. A few key features of FusionCharts include efficient rendering, responsive graphs, interactive interfaces, plotting of hundreds and thousands of data points, real-time charts, optimized views on mobile devices, portability across all types of operating systems and much much more.
Does FusionCharts Have a Flexible Pricing Structure?

Yes indeed! FusionCharts has a flexible pricing structure to suit your budget and requirements. Whether you are a startup, medium size business or large scale enterprise, we can give you a package and pricing model that is specially tailored to your needs.
Does FusionCharts (the Highcharts Alternative) have Cheaper Developers Cost?
The FusionCharts license for SaaS applications has pricing available. It includes a license for up to 5 developers with full access to 100+ charts and 2000+ maps. Similar to single developer license, there are unlimited support requests and live chat support. Compare this with Highcharts, where the cost of license for 5 developers with premium support is higher.
How Does Customer Support Compare – FusionCharts Vs. Highcharts?
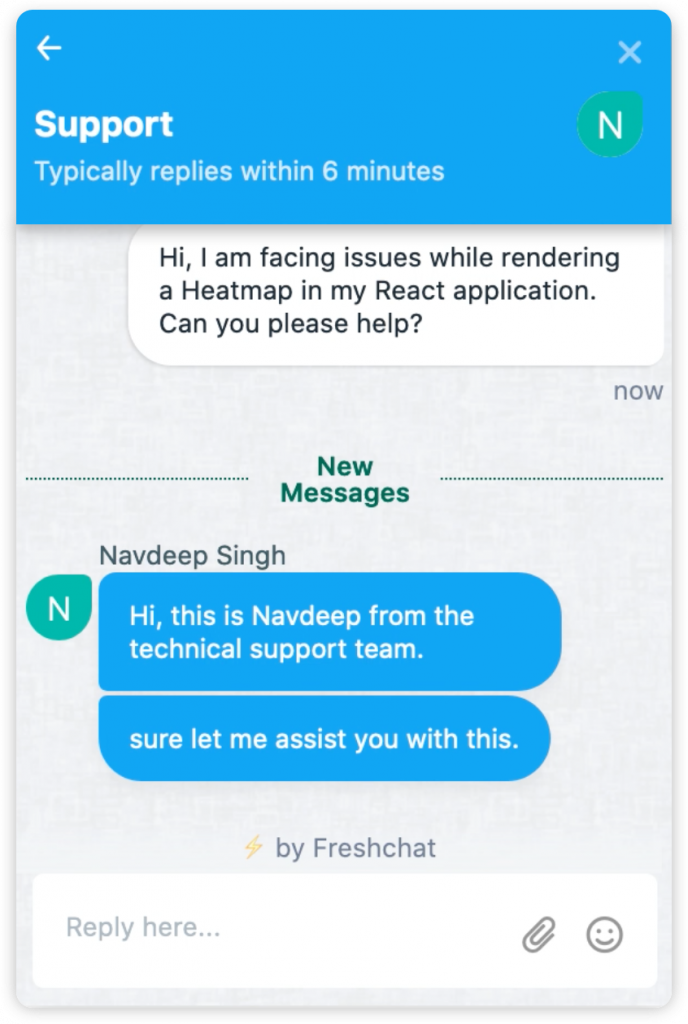
Highcharts customer support is spread out between forums, Skype(?), and email. In contrast, FusionCharts has a 24/7 dedicated technical support available via live chat on the Platinum Support plan in addition to email and forums. All your queries, issues and problems can be resolved within minutes when you go for FusionCharts.
Which Highcharts Alternative Has the Most Variety of Charts and Graphs?
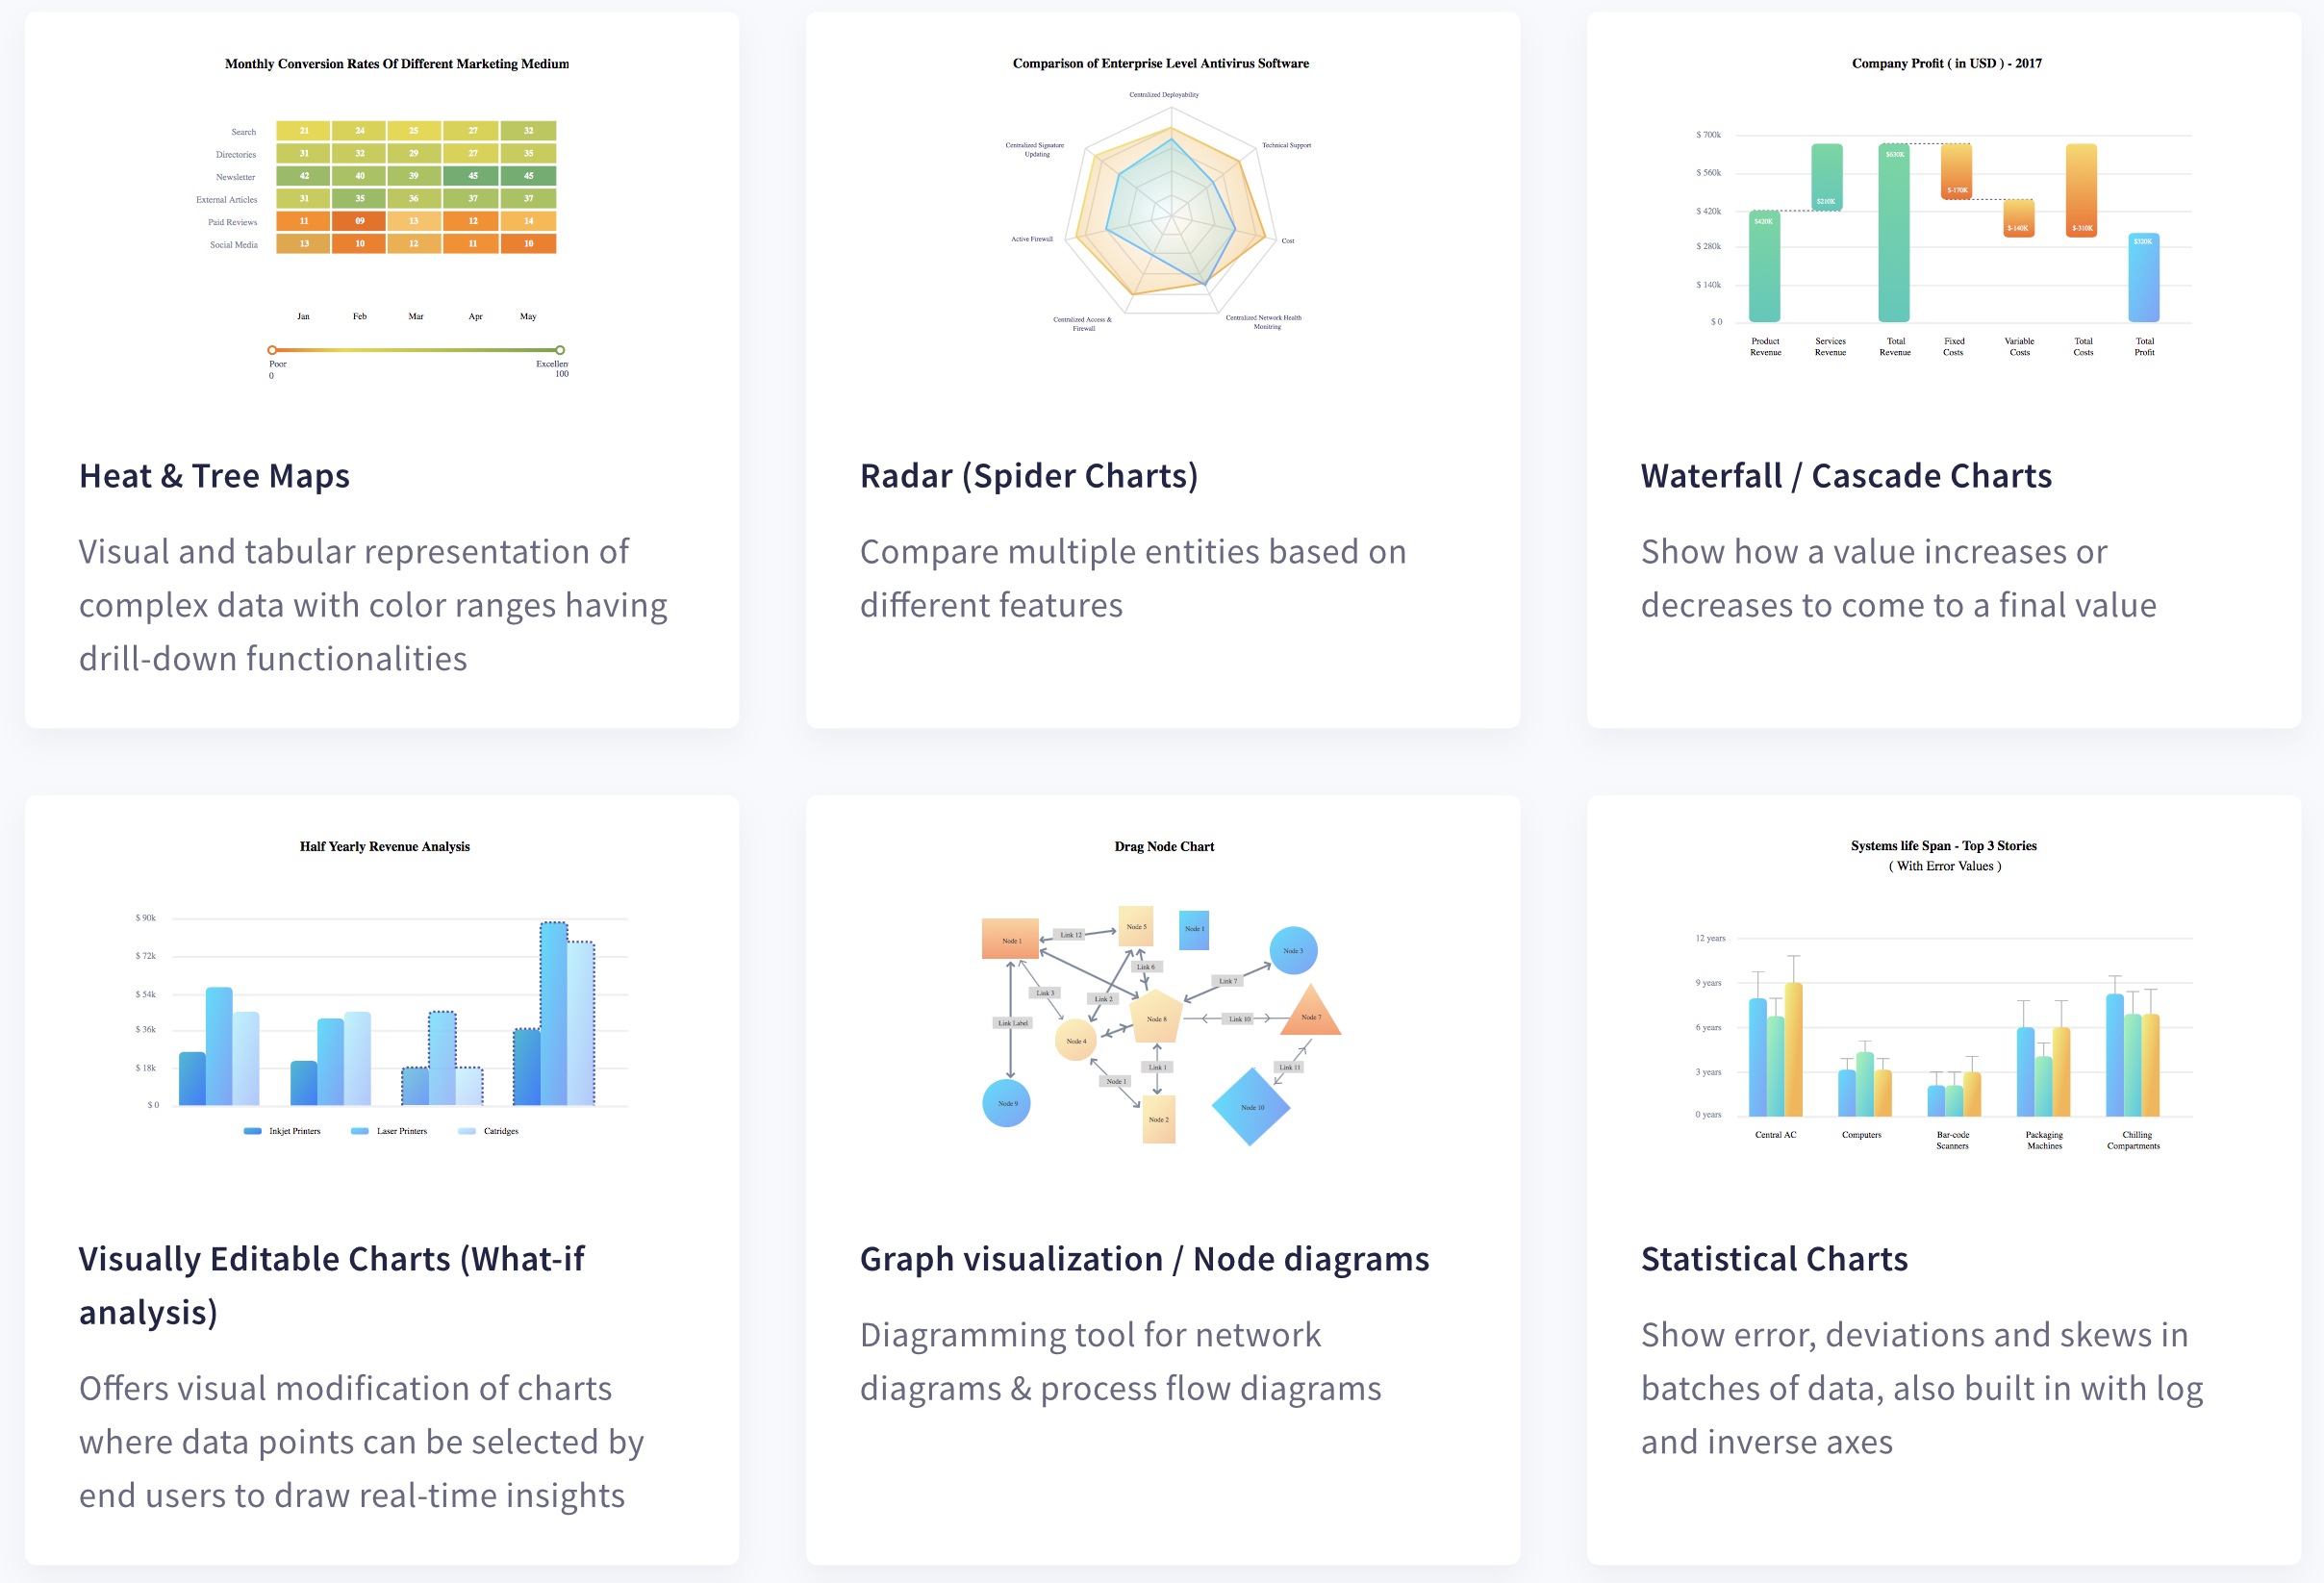
When it comes to the diversity of charts, graphs, gauges and maps, FusionCharts is the leader. FusionCharts supports all types of data visualization modes. It supports the more commonly used bar charts, area charts, line graphs and pie charts. There are also domain specific charts including Sankey charts, radar charts, dial charts, box and whiskers plots and more.
How Does FusionCharts Documentation Compare With Highcharts?
FusionCharts is unrivaled when it comes to extensive documentation, tutorials and code examples. There are code examples on how to call APIs for every framework. Additionally, there are all types of code samples that show how you can render different types of charts, gauges and maps in a standalone application or integrate them within your app.
Does FusionCharts Have a Shorter Development Time Compared to HighCharts?
FusionCharts has a wide variety of SDKs across many different frameworks and languages like React, PHP, Django, ASP.NET, Java, Angular, Vue, Svelte, jQuery, and many more. The learning curve for FusionCharts is very fast. You can have your first chart ready in around 15 minutes. You need very little coding experience to use FusionCharts. All components and data can be specified using JSON objects. Moreover, the well thought out APIs are consistent across all charts, graphs and maps, making it very easy to integrate FusionCharts visualizations in your software.
How Do I Get Started With FusionCharts?
FusionCharts is a beautiful data visualization library. It is the finest choice for you, if you want to create engaging, affective and aesthetically pleasing data presentations for your users. Make no mistakes by selecting mediocre products when you can settle for excellence.
Download FusionCharts today and make the most of your data now.
* The analysis in this article was taken on March 3, 2022 and the information at the time was accurate.
