When it comes to reporting and data visualization, there is no denying that it’s all about the presentation. How your present your data or ideas is key whether you’re trying to persuade and convince people, or you are simply communicating your thoughts. At the end of the day, good visuals make a world of a difference.
If you are looking to up your presentation game, FusionCharts is the right answer for you.
When it comes to deciding which platform to adopt for an effective way to create impressive, beautiful, and effective illustrations and visuals, FusionCharts offers unparalleled value. It allows developers to create 100+ charts, graphs, and gauges along with 2000+ maps. On top of that, it also allows users to export these data charts as images or PDF files using FusionExport. Users can easily export FusionCharts objects to high-quality images in their format of choice. FusionExport offers export formats like jpeg and png as well as SVG. In addition to the export format, export can also be done using your chosen programming language like Python, C#, Java, or PHP among others.
If this interests you, and you want to export your images easily then read on to find out how you can use FusionExport to export FusionCharts to images using FusionExport in the Python programming language.
Table of Contents
What is FusionExport?
FusionExport allows users to convert charts and dashboards to PDF files or as digital images. In addition to exporting a live dashboard in its current state, with FusionExport, you can also add new elements like your company logo to an object.
FusionExport is simple to install and works with all JavaScript charting libraries, e.g., FusionCharts, HighCharts, d3, Chart.js, etc. The SDKs for various programming languages are also available. So user can export charts using languages such as Java, Node.js, C#, Go, and much more.
How Do I Export A FusionChart Object From Python?
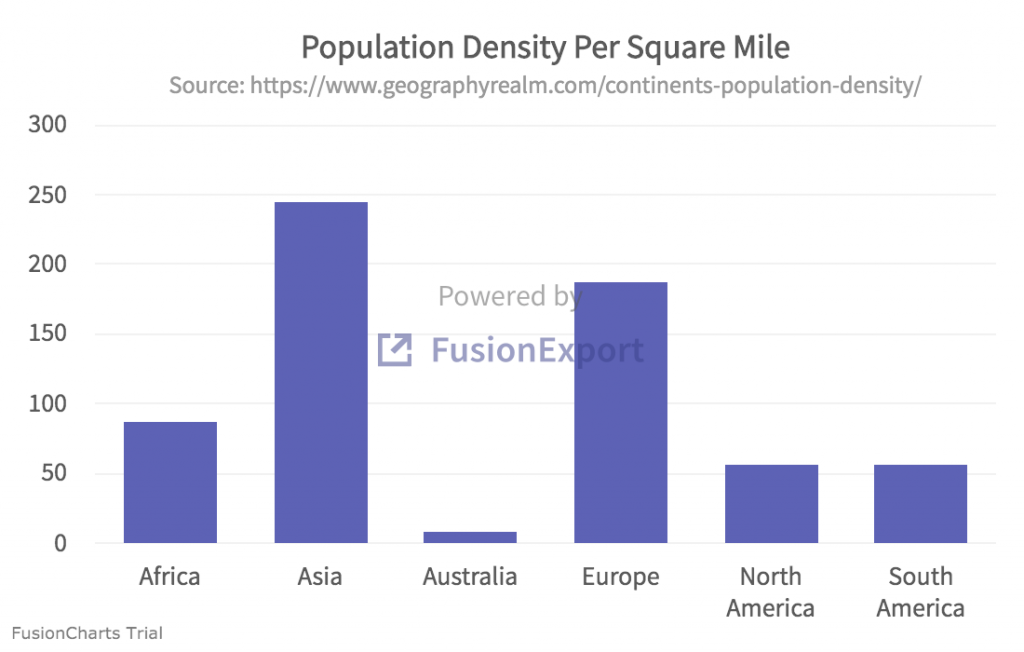
Exporting a chart from Python is easy. For this blog, we have created a 2D bar chart of the population density of different continents. We’ll export this chart as the .png file shown below.
Follow these five easy steps to create the above digital image.
Step 1: Download FusionExport Server
Download the FusionExport server for your OS from the FusionExport website.
Step 2: Run the server
Find the location of the installed server and run it by typing at the console, making sure to replace YOUR_PATH with the location of the server:
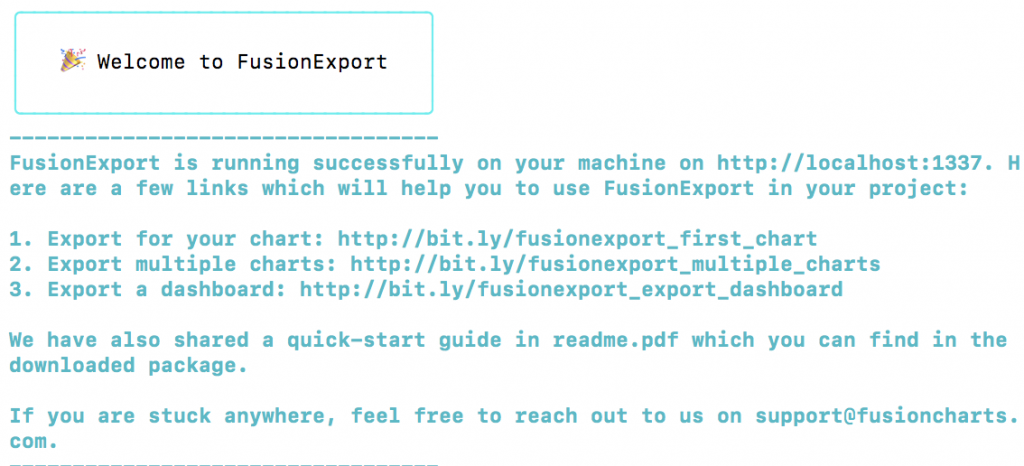
YOUR_PATH/fusionexportIf the server runs successfully, you will see the following:
Step 3: Install FusionExport SDK for Python
Assuming that you have Python installed on your machine, you can install the FusionExport SDK by typing the following at the command line:
pip install fusionexportStep 4: Create the Chart Configuration File
Create a file by the name of chart-config-file.json and copy the following code to it:
[{
    "type": "column2d",
    "renderAt": "chart-container",
    "width": "550",
    "height": "350",
    "dataFormat": "json",
    "dataSource": {
        "chart": {
            "caption": "Population Density Per Square Mile",
            "subCaption": "Source: https://www.geographyrealm.com/continents-population-density/",
            "theme": "fusion"
        },
        "data": [
            {
                "label": "Africa",
                "value": "87"
            },
            {
                "label": "Asia",
                "value": "246"
            },
            {
                "label": "Australia",
                "value": "8.3"
            },
            {
                "label": "Europe",
                "value": "188"
            },
            {
                "label": "North America",
                "value": "57"
            },
            {
                "label": "South America",
                "value": "57"
            }
        ]
    }
}]
Step 5: Create Python File
Create the export_chart.py file, and copy the following code to it. Each step of the process is also commented in the code below.
# Import sdk
from fusionexport import ExportManager, ExportConfig
# Import json library
import json


# Load the JSON chart configuration file
chart_json_file = open('chart-config-file.json')
config = json.load(chart_json_file)

# Instantiate the ExportConfig class and add the required configurations
export_config = ExportConfig()
export_config["chartConfig"] = config

# Various options are: 'png', 'jpeg' 'pdf' and 'svg'
export_config["type"] = 'png'

# Port and host of FusionExport Service
export_server_host = "127.0.0.1"
export_server_port = 1337

# Instantiate the ExportManager class
export_manager = ExportManager(export_server_host, export_server_port)

# Call the export() method with the export_config as an argument
export_manager.export(export_config, output_dir = ".", unzip = True)
How Do I Run The Code?
You can run the code by typing at the console:
python export_chart.pyThat’s it! Running the line of code above creates a file export.png containing the specified chart.
Download the full source code for the FusionExport example with Python on GitHub.
Are There More FusionExport Features?
Yes. There are plenty of FusionExport features for your business to leverage. FusionExport offers a variety of options for exporting dashboards, charts and graphs. These files are printable, can be shared via email or added to presentations.
Download your free FusionExport trial today and get started on exporting high quality images of beautiful and awesome charts, maps and gauges.
