Windows Presentation Foundation (WPF) is a graphical subsystem used to create Windows-based desktop client applications with visually stunning user interfaces. WPF offers a consistent programming model for developing applications.
We can use modern graphics hardware because the rendering engine is resolution-independent and vector-based. WPF adds to the core a comprehensive set of application-development features such as Extensible Application Markup Language (XAML) (XAML).
In this post, we’ll look at a tutorial that discusses how Data Charts can be rendered in a WPF application using Visual Studio, as well as how to solve a rendering problem if you’ve encountered one.
In the WPF application, you can render charts using two different ways:
- Rendering charts by generating HTML as a string and passing it to the WebBrowser control.
- Rendering charts by including FusionCharts ASP.NET server-side wrapper.
Table of Contents
System Requirements
We need the following applications installed before rendering charts in WPF application using Visual Studio:
- Visual Studio IDE and .NET Framework [Download Link]
- FusionCharts Suite XT [Download Link]
- FusionCharts ASP.NET Wrapper [Download Link]
Method 1: Rendering Charts by Passing the HTML String to WebBrowser Control
Steps
1. Open Visual Studio. From the File menu, select New > Project.

New Project dialog box appears.
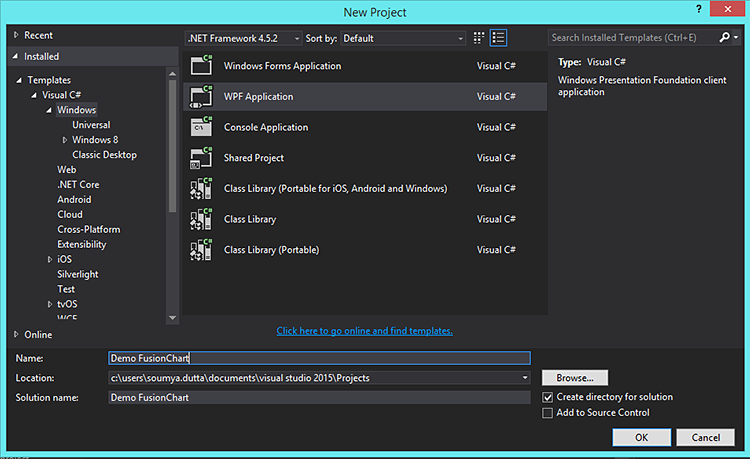
2. From Installed > Templates, select WPF Application and name the project as shown in the image below:
3. Creating a project by default opens Mainwindow.xaml and MainWindow.xaml.cs as shown below:

4. In MainWindow.xaml, drag and drop the label control and WebBrowser control from the Toolbox as shown below:

5. Select MainWindow.xaml and press f4 to open the properties window. Select the event button and double-click the loaded event. Refer to the image below:

6. A code file with Grid_Loaded event handler opens as shown below:

7. The Grid_Loaded event handler pops up within MainWindow.xaml.cs as shown below:
private void Grid_Loaded(object sender, RoutedEventArgs e) {

}
8. Insert the code given below to Grid_loaded event handler:
label.Content = "Rendering FusionCharts in WPF application";

StringBuilder html = new StringBuilder();
html.Append("");
html.Append("");
html.Append("");
html.AppendFormat("");
html.Append("");
html.Append("FusionCharts.ready(function () {");
html.Append("var revenueChart = new FusionCharts({");
html.Append("type: 'column2d',");
html.Append("renderAt: 'chart-container',");
html.Append("width: '500',");
html.Append("height: '200',");
html.Append("dataFormat: 'json',");
html.Append("dataSource: {'chart': {'caption': 'Sales of Liquor', 'subCaption': 'Last week', 'xAxisName': 'Day', 'yAxisName': 'Sales (In USD)', 'numberPrefix': '$', 'paletteColors': '#0075c2', 'bgColor': '#ffffff', 'showBorder': '0', 'showCanvasBorder': '0', 'plotBorderAlpha': '10', 'usePlotGradientColor': '0', 'plotFillAlpha': '50', 'showXAxisLine': '1', 'axisLineAlpha': '25', 'divLineAlpha': '10', 'showValues': '1', 'showAlternateHGridColor': '0', 'captionFontSize': '14', 'subcaptionFontSize': '14', 'subcaptionFontBold': '0', 'toolTipColor': '#ffffff', 'toolTipBorderThickness': '0', 'toolTipBgColor': '#000000', 'toolTipBgAlpha': '80', 'toolTipBorderRadius': '2', 'toolTipPadding': '5'}, 'data': [{'label': 'Mon', 'value': '4123'}, {'label': 'Tue', 'value': '4633'}, {'label': 'Wed', 'value': '5507'}, {'label': 'Thu', 'value': '4910'}, {'label': 'Fri', 'value': '5529'}, {'label': 'Sat', 'value': '5803'}, {'label': 'Sun', 'value': '6202'} ] }");
html.Append("});");
html.Append("revenueChart.render();");
html.Append("});");
html.Append("");
html.Append("");
html.Append("");
html.Append("
“); html.Append(”
");
html.Append("");

webb.NavigateToString(html.ToString());
9. Run the application. The output looks like as shown in the image below:

Method 2: Render Charts Using FusionCharts ASP.NET Wrapper
To create charts using FusionCharts ASP.NET server-side wrapper, follow steps 1 to 6 of Method 1, which will create the WPF application and webBrowser control. The additional steps are stated below:
Steps
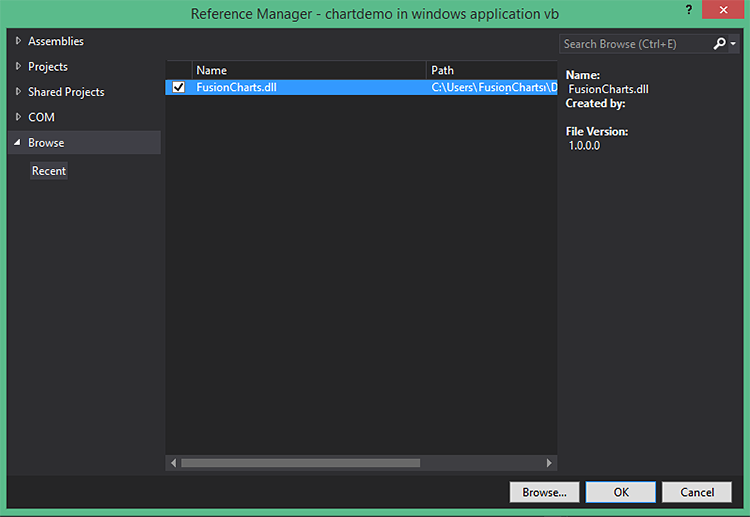
1. Search for FusionCharts.dll in your local machine and add it to the project. Refer to the image below:
2. In MainWindow.xaml.cs, add FusionCharts namespace as shown below:
using FusionCharts.Charts;3. In Grid_Loaded event handler, add the code given below:
label.Content = "Rendering FusionCharts in WPF application";
StringBuilder chart = new StringBuilder();
chart.Append("{'chart': {'caption': 'Sales of Liquor', 'subCaption': 'Last week', 'xAxisName': 'Day', 'yAxisName': 'Sales (In USD)', 'numberPrefix': '$', 'paletteColors': '#0075c2', 'bgColor': '#ffffff', 'showBorder': '0', 'showCanvasBorder': '0', 'plotBorderAlpha': '10', 'usePlotGradientColor': '0', 'plotFillAlpha': '50', 'showXAxisLine': '1', 'axisLineAlpha': '25', 'divLineAlpha': '10', 'showValues': '1', 'showAlternateHGridColor': '0', 'captionFontSize': '14', 'subcaptionFontSize': '14', 'subcaptionFontBold': '0', 'toolTipColor': '#ffffff', 'toolTipBorderThickness': '0', 'toolTipBgColor': '#000000', 'toolTipBgAlpha': '80', 'toolTipBorderRadius': '2', 'toolTipPadding': '5'}, 'data': [{'label': 'Mon', 'value': '4123'}, {'label': 'Tue', 'value': '4633'}, {'label': 'Wed', 'value': '5507'}, {'label': 'Thu', 'value': '4910'}, {'label': 'Fri', 'value': '5529'}, {'label': 'Sat', 'value': '5803'}, {'label': 'Sun', 'value': '6202'} ] }");
Chart revenueChart = new Chart("column2d", "ch1", "400", "400", "json", chart.ToString());
StringBuilder Total = new StringBuilder();
Total.Append("");
Total.Append("");
Total.Append("");
Total.AppendFormat("");
Total.Append("");
string chartdata = revenueChart.Render();
Total.Append(chartdata);
Total.Append("");
Total.Append("");
webb.NavigateToString(Total.ToString());
4. Run the application. The output looks like as shown in the image below:
If you find any difficulty in rendering the chart or you see any error in your code, click here to download the complete source code of the sample project we have created for this tutorial.
Was There a Problem Rendering the Charts?
In case something went wrong, and you are unable to see the chart, check for the following:
- The chart ID should be unique for all charts rendered on the same page. Otherwise, it will result in a JavaScript error.
- If the chart does not show up, check if the fusioncharts.js and FusionCharts wrapper FusionCharts.java were loaded. Also, check if the path to the fusioncharts.js and the FusionCharts.java files is correct and whether the files exist in that location.