Visual Basic.Net is a popular object-oriented programming language that is built on the.NET framework. We already have detailed documentation on how to use the FusionCharts VB.NET wrapper to create Data Charts in VB.NET.
In this post, we’ll cover a tutorial that shows how to use the database to render FusionCharts in Visual Basic.NET. Let’s begin with the prerequisites and steps for rendering FusionCharts in VB.NET using a database.
Table of Contents
System Requirements
To start rendering charts in VB.NET, we need to make sure that we have the following components downloaded on our local machine:
- Visual Studio IDE and .NET Framework [Download Link]
- FusionCharts VB.NET Wrapper [Download Link]
Creating an ASP.NET Application in Visual Basic
Follow the steps given below to create an ASP.NET application using VB:
Step 1: Open Visual Studio. Click File->New. The File menu appears. In the menu Select Project. Refer to the image below:
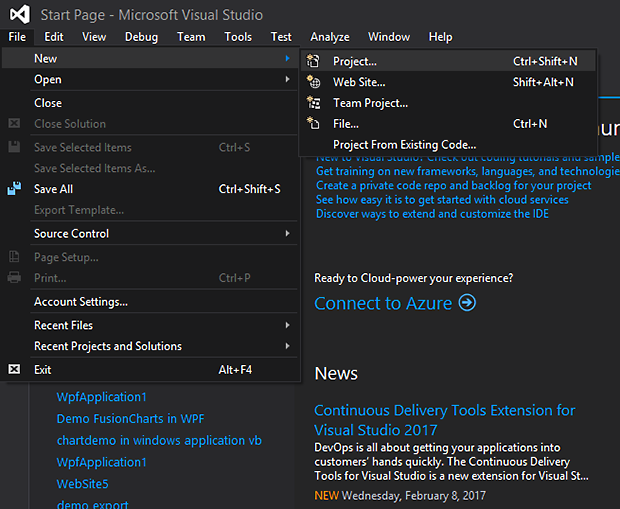
Creating New Project
Step 2: Select Visual Basic from the installed templates. Select ASP.NET application as shown in the image below:
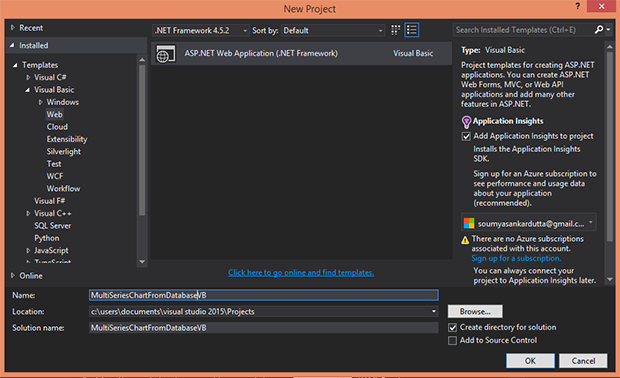
Select ASP.NET Web Application as Project Type
Step 3: Create a project hierarchy named MultiSeriesChartFromDatabaseFromVB. Refer to the image below:

Project Hierarchy
Creating a Database
Here we’ll create a multi-series column chart using data from the database. The chart will showcase a comparison between the factories’ output w.r.t quality. Following are the steps to create a multi-series column chart in VB.NET.
Step 1: Create a database (the name of the database is FactoryDb in our case) with two tables that showcase the date-wise production output of three different factories. The image below shows the schema diagram for the table:
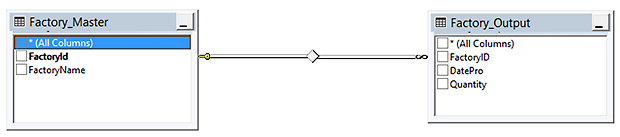
Schema Diagram for the Database
Step 2: Add the App_Data ASP.NET folder into the created project.
Click (right-click) Project_Name -> Select Add
Click Add ASP.NET Folder option -> Select App_Data
Refer to the image below:

Adding the App_Data ASP.NET Folder
Step 3: Finally, insert FactoryDb in the App_Data folder.
The database is created and is ready to connect. Next, we will see how to connect with the database.
Establish Database Connection
To hold the connection property in a centralized location, the connection properties should be defined using <connectionStrings> tag in the web.config file. Web.config file is by default created within the project for holding the configurations of web applications. Follow the steps below to define the connection property in web.config file:
- Open Web.config file and locate <configuration> tag
- Add <connectionStrings> tag after <configuration> tag
- Define <connectionStrings> as shown below:
<add name="MSAccessConnection" connectionString="Provider=Microsoft.Jet.OLEDB.4.0; Data Source=|DataDirectory|FactoryDB.mdb" providerName="System.Data.OleDb"></add> - Save the Web.config file
Add an .aspx File for Creating Charts
Step 1: Add a folder named scripts inside the project and include all the FusionCharts js files into the scripts folder. The folder structure of the project is shown in the image below:
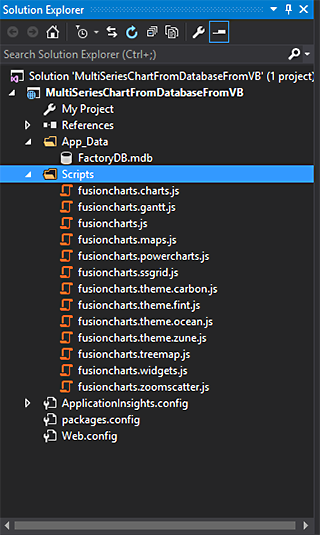
Add scripts folder
Step 2: Add FusionCharts.dll (as a reference) into the project to use FusionCharts VB.NET wrapper. To add FusionCharts.dll as a reference:
- Right-click on References->Select Add References. Refer to the image below:

Add Reference to the project
- Selecting Add Reference in the above step will open a Reference Manager dialogue box. Search for FusionCharts.dll in your local machine and add it to this box. Refer to the image below:
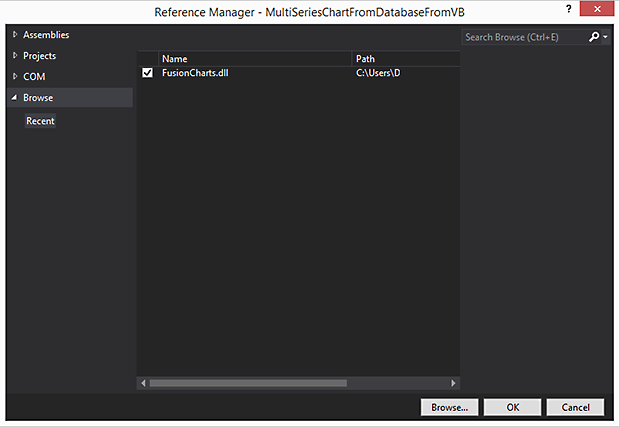
Add FusionCharts reference within the Project
Step 3: Add a new file (.aspx) named “Multiseriesdemo” within the project hierarchy.
Step 4: Include the fusioncharts.js and fusioncharts.charts.js libraries within <head> tag of Multiseriesdemo.aspx file as shown below:
<script type="text/javascript" src="scripts/fusioncharts.js"></script>Step 5: Include the literal control within the newly created aspx page as shown below:
<asp:literal ID="Literal1" runat="server"></asp:literal>Step 6: In Multiseriesdemo.aspx.vb, add the following namespaces with the existing ones:
- Imports System.Data.Odbc
- Imports FusionCharts.Charts
- Imports System.Data.OleDb
- Imports System.Configuration
Step 7: Within Multiseriesdemo.aspx.vb, define a class DbConn and include the code given below:
Public Class DbConn

    '  Create a database Connection. using here Access Database
    '  Return type object of OdbcConnection

    Public connection As OleDbConnection
    Public ReadData As OleDbDataReader
    Public aCommand As OleDbCommand


    Public Sub New(strQuery As String)
        ' MS Access DataBase Connection - Defined in Web.Config
        Dim connectionName As String = "MSAccessConnection"

        ' SQL Server DataBase Connection - Defined in Web.Config
        'string connectionName = "SQLServerConnection";

        ' Creating Connection string using web.config connection string
        Dim ConnectionString As String = ConfigurationManager.ConnectionStrings(connectionName).ConnectionString
        Try
            ' create connection object
            connection = New OleDbConnection()
            ' set connection string
            connection.ConnectionString = ConnectionString
            ' open connection
            connection.Open()
            ' get reader
            GetReader(strQuery)
        Catch e As Exception
            HttpContext.Current.Response.Write(e.Message.ToString())

        End Try
    End Sub

    ' Create an instance dataReader
    ' Return type object of OdbcDataReader
    '''
    ''' Get Data Reader
    '''
Public Sub GetReader(strQuery As String) ‘ Create a Command object aCommand = New OleDbCommand(strQuery, connection) ‘ Create data reader object using strQuery string ‘ Auto close connection ReadData = aCommand.ExecuteReader(CommandBehavior.CloseConnection) End Sub End Class
Step 8: In the Page_Load event handler write the following code to recreate the JSON structure with the values fetched from the database. Pass the JSON string to the chart constructor and call the Render() method.
' Create the `jsonData` StringBuilder object to store the data fetched
        'from the database as a string.
        Dim jsonData As New StringBuilder()

        Dim ReqDatasetComma As Boolean = False, ReqComma As Boolean = False

        ' Initialize the chart-level attributes and append them to the
        '`jsonData` StringBuilder object.
        ' add chart level attrubutes
        jsonData.Append("{" + "'chart': {" + "'caption': 'Factory Output report'," + "'subCaption': 'By Quantity'," + "'formatNumberScale': '0'," + "'rotatelabels': '1'," + "'showvalues': '0'," + "'showBorder': '1'" + "},")

        ' Initialize the Categories object.
        jsonData.Append("'categories': [" + "{" + "'category': [")

        ' Every date between January 01, 2003 and January 20, 2003 is entered thrice
        ' in the datepro field in the FactoryDB database.
        ' The dates will be shown as category labels on the x-axis of the chart.
        ' Because we need to show each date only once, use the `select` query
        ' with the `distinct` keyword to fetch only one instance of each date from the database.
        ' Store the output of the `select` query in the `factoryQuery` string variable.
        Dim factoryQuery As String = "select distinct format(datepro,'dd/mm/yyyy') as dd from factory_output"

        ' Establish the database connection.
        Dim oRs As New DbConn(factoryQuery)

        ' Iterate through the data in the `factoryQuery` variable and add the dates as
        ' labels to the category object.
        ' Append this data to the `jsonData` object.
        While oRs.ReadData.Read()
            If ReqComma Then
                jsonData.Append(",")
            Else
                ReqComma = True
            End If

            ' category level attributes
            jsonData.AppendFormat("{{" + "'label': '{0}'" + "}}", oRs.ReadData("dd").ToString())
        End While

        'Close the database connection.
        oRs.ReadData.Close()

        'Close the catgories object.
        jsonData.Append("]" + "}" + "],")

        ' Initialize the Dataset object.
        jsonData.Append("'dataset': [")


        'Fetch all details for the three factories from the Factory_Master table
        ' and store the result in the `factoryquery2` variable.
        Dim factoryquery2 As String = "select * from factory_master"

        'Establish the database connection.
        Dim oRs1 As New DbConn(factoryquery2)


        ' Iterate through the results in the `factoryquery2` variable to fetch the
        ' factory  name and factory id.
        While oRs1.ReadData.Read()
            If ReqDatasetComma Then
                jsonData.Append(",")
            Else
                ReqDatasetComma = True
            End If
            ' Append the factory name as the value for the `seriesName` attribute.
            ' dataset level attributes
            jsonData.AppendFormat("{{" + "'seriesname': '{0}'," + "'data': [", oRs1.ReadData("factoryname").ToString())

            ' Based on the factory id, fetch the quantity produced by each factory on each day
            ' from the factory_output table.
            ' Store the results in the `factoryquery3` string object.
            Dim factoryquery3 As String = "select quantity from factory_output where factoryid=" + oRs1.ReadData("factoryid").ToString()

            'Establish the database connection.
            Dim oRs2 As New DbConn(factoryquery3)

            ReqComma = False

            ' Iterate through the results in the `factoryquery3` object and fetch the quantity details
            ' for each factory.
            ' Append the quantity details as the the value for the `` element.
            While oRs2.ReadData.Read()
                If ReqComma Then
                    jsonData.Append(",")
                Else
                    ReqComma = True
                End If

                ' data set attributes
                jsonData.AppendFormat("{{" + "'value': '{0}'" + "}}", oRs2.ReadData(0).ToString())
            End While

            ' Close the database connection.
            oRs2.ReadData.Close()

            ' Close individual dataset object.
            jsonData.Append("]" + "}")
        End While

        ' Close the database connection.
        oRs1.ReadData.Close()

        ' Close the JSON object.
        jsonData.Append("]" + "}")

        ' Initialize chart - MSLine Chart data pulling from database
        Dim factoryOutput As New Chart("mscolumn2d", "myChart", "600", "350", "json", jsonData.ToString())
        ' Render the chart
        Literal1.Text = factoryOutput.Render()
Step 9: Right-click on Multiseriesdemo.aspx file and select Set As Start Page from the options listed.

Start Page option
Step 10: Now, you are ready to render FusionCharts in your visual basic. Press ctrl + f5 to run and check the output of the chart as shown in the image below:
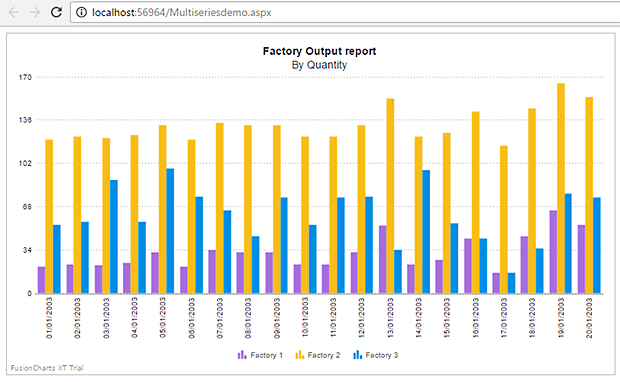
Multi-Series Column 2D Chart
If you find any difficulty in rendering the chart or you see any error in your code, not to worry! Please click here to download the complete source code of the sample project we have created for this tutorial.