Even though there are many server-side languages, PHP is still the most commonly used. That means there is a pretty good chance that at some point when you’re working on a PHP app, you will need a chart to display your data in a way your end-user can easily understand, analyze and use to make informed decisions. Whether you are building dashboards or reports, charts are a great way to present visual data effectively.
Ready to get started adding visually stunning charts in your PHP apps? FusionCharts provides a simple and easy way to add powerful interactive data charts using our PHP SDK.
Table of Contents
Why Use FusionCharts for Your PHP Apps?
FusionCharts offers a number of useful features that allow you to quickly and easily add beautiful charts to your PHP apps.
Interactivity
Many PHP charting solutions out there only produce image-based charts/static images of charts, which means you cannot interact with them. FusionCharts, on the other hand, offers several interactive options for creating stunning and easy to visualize charts. For example, you can show and hide data series in column charts, see more data points with scroll charts, create drag-able charts, and much more.
Variety of Data Types
FusionCharts offers multiple ways to add charts to your PHP apps. You can insert charts by using the JSON or XML URL. You can also add charts by fetching data from a database.
Simplicity: No JavaScript Code Required
FusionCharts makes things super easy for PHP developers because it allows you to execute your projects without the need to write separate JavaScript code.
Numerous Chart Types
With the PHP Module for FusionCharts, you can choose from more than 150 charts for your web applications, be it a line, pie, doughnut, Gantt, Pareto, bar, column, or any other chart of your choice. In addition, you can make your reports more insightful using by choosing from over 2000 maps.
Advanced Control for Chart Configurations
You can configure your charts the way you want with FusionCharts. It provides complete control over chart configurations by giving you full access to FusionCharts objects.
Ease of Use
One of the best things about FusionCharts is that it doesn’t involve any learning curve. With its extensive and easy-to-understand documentation, you can literally create your first chart in no more than 15 minutes. This is a huge benefit as you don’t have to spend time learning the software.
Direct Database Connection
To make things easy and quick, FusionCharts lets you connect your chart directly to any database of your choice, be it SQL or NoSQL.
Compatible with Thousands of Data Points
You can create any chart with FusionCharts using millions of data points, and you won’t face any performance issues.
How to Create Charts for PHP Apps Using Database?
You can fetch data for your charts from a database and create any chart for your PHP apps using the FusionCharts PHP wrapper.
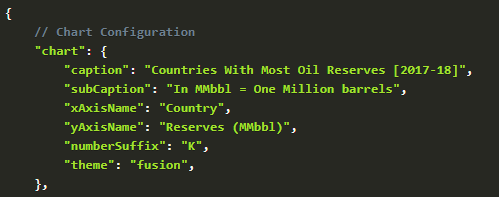
Let’s say you have a dataset of countries with the most oil reserves in a database, and you want to create a 2D chart from this data. You can use the steps below to create a 2D chart or any chart of your choice using a database.
Step 1
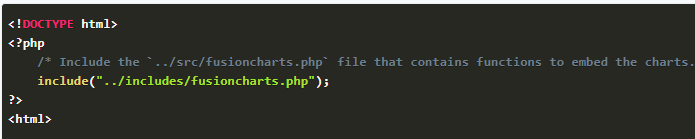
Start by including the fusioncharts.php file/ PHP wrapper. This is the file that contains the functions to embed the chart.
![]()
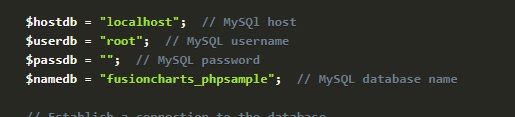
Step 2
Next, add the database connection information by using the following code
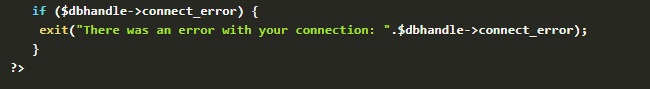
Step 3
Now, establish a connection to the database using the code below
![]()
Step 4
At this point, it’s best to add code lines for rendering error messages in case the database connection parameters are incorrect. This will help prevent abrupt failure.
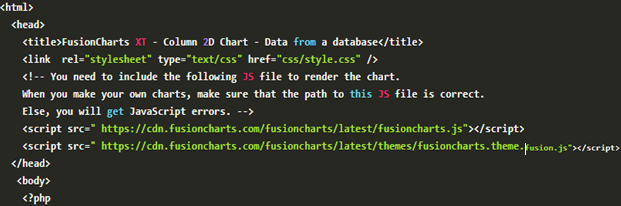
Step 5
Now, include the necessary JS files to create the chart
Step 6
Create the SQL query which will return the countries with the most oil reserves and execute it or return the error message.
![]()
If a valid response is returned by the query, prepare the JSON string.
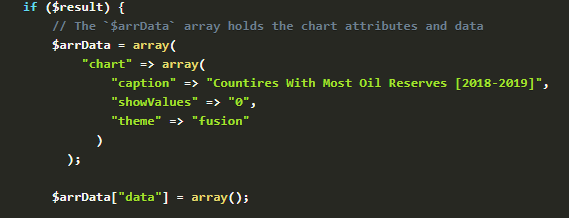
Step 7
Then push the data into the array and if you want to use JSON data, create a variable that holds all the JSON data for your chart.
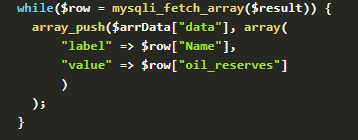
![]()
Step 8
Next, use the FusionCharts PHP class constructor to create an object for the column chart.
![]()
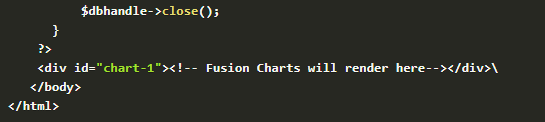
Then render the chart.
![]()
Step 9
Finally, close the database connection.
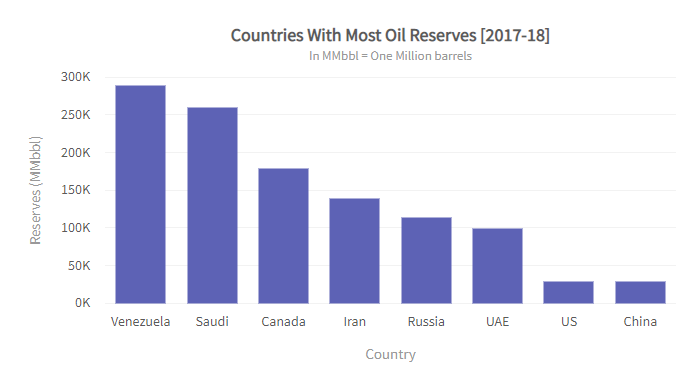
This is how your final chart will look:
How to Set Data Source Using URL to Create Charts for PHP Apps?
FusionCharts also lets you insert charts for a JSON and XML URL by allowing you to save the data in a .xml or .json file and pass the URL of the file as value to the dataSource attribute.
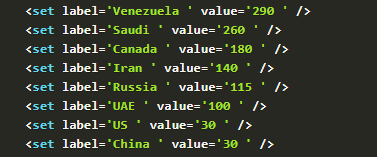
We’ll be creating the same 2D chart of countries with the most oil reserves that we built above using a database. This time, however, we’ll use JSON and XML URL.
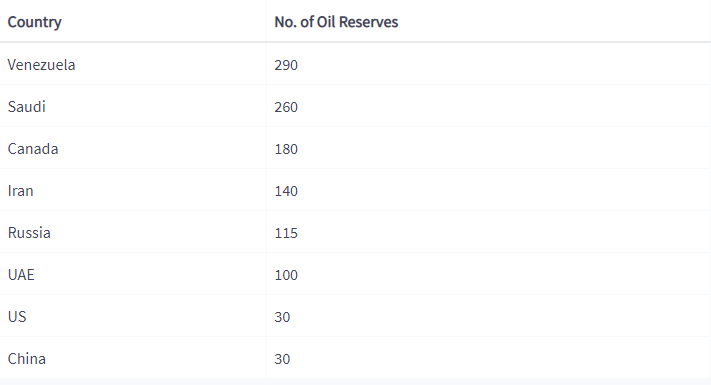
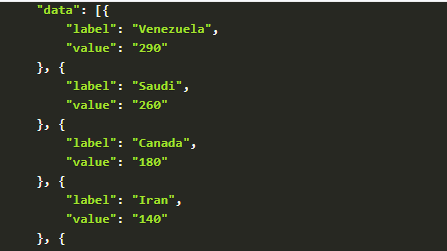
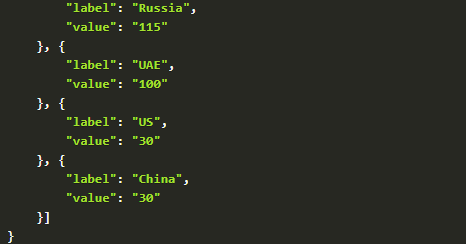
We’ll be using the following dataset:
How to Load Data Using JSON as URL?
Step 1
First, represent the above dataset in JSON as follows
Then copy this into a file, name it and save it with .json extension. We’ve named our file oilReserves.json. Remember to store the file in the same folder as your HTML page.
Step 2
Now, we’ll write the code. To do so, start with including the fusioncharts.php file/ PHP wrapper, which contains the functions to embed the chart.
Step 3
Next, include the required libraries and components, such as fusioncharts.js, fusioncharts.theme.fusion.js.
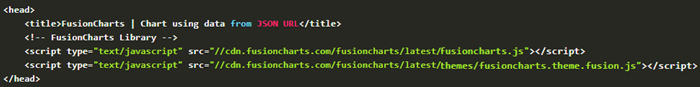
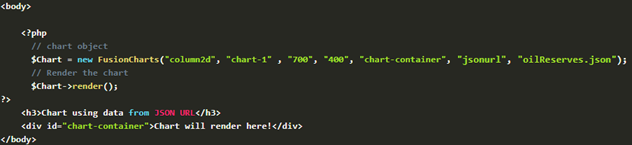
Step 4
Now, store the configuration of the chart in a JSON object, set the data source using a URL, and create a chart container as follows:
- Set column2d as chart type
- Include the width and height of the chart in the form of pixels.
- Choose the dataFormat as JSON and embed the JSON data as the value to dataSource.
- Set the dataFormat value to jsonurl
- Set the static URL to dataSource
How to Load Data Using XML as URL?
First, represent the dataset in XML as follows:
Then copy this into a file named oilReserves.xml and store it in the same folder as your HTML page.
All the other steps are the same as “loading data using JSON as URL,” except we have to embed XML data as the value of data source and set the data format to xmlurl instead of jsonurl.
Ready to Supercharge Your PHP Apps?
Now that you know how to create any chart of your choice by fetching data from a datasource or using JSON/XML URL, you can use FusionCharts to create stunning charts for your PHP apps and take your data visualization to the next level.
Download FusionCharts Suite XT for PHP and start building interactive charts today!