Data visualizations are one of the most common ways of communicating data trends and insights. They are certainly more user-friendly than boring tables and spreadsheets. By infusing color and design elements, data visualizations help your audience better understand your data.
The web is the most common way to showcase data visualizations but you can share them in other formats like PDFs and JPGs. PDFs are great, but hosting your visualizations on your website ensures that everyone who counts can easily visit and explore them. Putting your data visualizations on the web, however, does involve the challenge of integrating them with your front-end technology.
It really isn’t much of a challenge though. Most front-end development frameworks support data visualization libraries for charting and graphing your data. A framework like React is incredibly open to integration with most major data visualization libraries like FusionCharts. That said, even if you use FusionCharts, you still need to understand what makes a data visualization great if you want to create solid charts and provide an impressive user experience.
This article takes you through some of the details that make a React chart great and how you make your data visualizations great too.
Table of Contents
What Makes React A Great Framework For Hosting Charts?

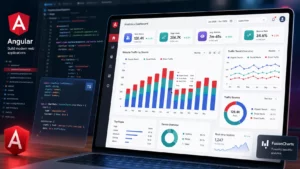
React is among today’s most popular front-end development frameworks. Many major enterprises use it to make dynamic and appealing front-ends for their websites. In addition, it is often the developer’s first choice for a front-end technology due. This is due to its robust interface and reactive nature. It is a solid contender for host data visualizations that dynamically update as the data changes.
Its robustness makes it possible to construct native React charts that have a modern UI and appear much more inviting than two-dimensional, static, charts. However, most veterans advise using a dedicated data visualization library alongside React to make better charts and graphs.
When you are looking for a powerful data visualization library, here are some things you should look out for:
- Performance: Adding a library shouldn’t slow your React project overall.
- Easy Interface: An interface made up of intuitive methods for data handling means less time and effort spent getting past the learning curve.
- Powerful Integration: The library should neatly integrate with React and leverage features like virtual DOM.
FusionCharts does all of this seamlessly. This is because it easily integrates with React and other top front-end technologies. Setting up React, adding, and using FusionCharts is easy thanks to its programming interface. It is also a favorite in the industry primarily due to its performance.
What Makes A React Chart Successful?

Everyone in today’s business ecosystem wants the skills to make compelling data visualizations. What’s more, there are dozens of resources that provide a guide to creating them. Very few resources, however, help you build the skills to create great data visualizations. Instead, they give you a finished solution. This article aims to help you understand the characteristics of a great React chart so you can make one for yourself. Here are some things you need to consider when you set out to create a chart for React:
Is Your Purpose Clear?
When you create any data visualization, its final aim must be clear. If your React chart creation process begins on a clear note about what it aims to achieve, everything will go more smoothly. Moreover, your chart will actually deliver value to the end-user. If you are confused about what you wish to accomplish with your chart the result will be a poor quality waste of time and effort.
We use data visualizations for many different purposes, including exploratory analyses and data storytelling. Each purpose requires a different set of design choices and results in a different product. A data visualization library like FusionCharts provides you with visualizations for many purposes, and you can modify each small detail so your visualization serves your purpose better.
Are You Using The Right Chart For The Job?
A key aspect of making a great React chart is ensuring it is the right chart for the job. Although this seems obvious, users make the mistake of choosing the wrong visualization a bit too often. This results in charts that fail to demonstrate the intricacies of the data trends you want to communicate. That is why constructing a great chart means choosing the appropriate chart type, to begin with.
If you have chosen FusionCharts to create your React chart, you can explore and choose from an extensive collection of graphs and charts. Additionally, configuring each choice is easy, so you can even try out multiple ones before settling on one. Such flexibility ensures you choose visualizations that go well with the front-end and communicate the data insights properly. The documentation can also help with choosing the right chart for the case.
Does it offer Interactivity?
Offering chart interactivity is the easiest way to ensure your React chart stands out and delivers a unique user experience. By doing so, you immediately establish your visualization in a different class from static visualizations. It also allows your users to explore your chart. They can tweak a detail here and there for more insights. The final experience is much more than a non-interactive visualization can provide.
Interactivity is a default feature in FusionCharts charts and graphs. Any React chart you make is interactive in small ways. For example, your users can hover over certain parts of your graph for finer detail. You can also code it to be much more interactive and give your audience control elements like buttons and sliders.
Does it have Smart Color Coordination?
A great React chart doesn’t just focus on data visualization, it also has intelligent design choices. Visual appeal is essential for more effective data storytelling — your color choices determine whether or not your chart is pleasant to look at. Therefore, use the appropriate colors that don’t tire the eye and nicely complement each other. You can also take the opportunity to make the chart more inclusive for color-blind individuals.
You can use colors to bring your audience’s attention to a certain point or establish the contrast between details by using opposite color schemes. With FusionCharts, you can infuse your chart with different pre-installed themes or even custom ones. Additionally, all color themes are modern and sleek to give your chart a unique visual flair to help it stand out. There are many examples that you can use for inspiration.
Does your React Chart Present Information Intuitively?
By ensuring your React chart intuitively communicates essential details, you can be confident it will be effective. You can significantly improve a chart’s readability by adding in extra, relevant, details. This could mean sharing an extra metric to clarify a value or adding labels that point out an essential correlation. Laying things out intuitively will make users seek out your charts over those of others.
Robust data visualization libraries like FusionCharts allow you easily add these important details to your charts. You can add labels, animations, and numbers to support your visualization’s purpose. FusionCharts customizability also means you can make and modify the information you add to a visualization. Just remember some additions just aren’t necessary — you need to develop a sense of what adds to your data storytelling and what adds clutter.
Ready to get started with a powerful React chart?
Head over and take a look at powerful React charts with FusionCharts.