The more data you gather, the more important it is to have a good data visualization library. In this case, “good” means a data visualization library that helps you create aesthetically appealing and effective data presentations that also provide live charts that can update in real-time. The FusionCharts charting and graphing library does exactly that. That is why it is one of the most popular data visualization tools out there. In addition to delivering stunning data presentations, Fusion charts can easily handle millions of data points while updating your charts in real-time to give you a clear picture of exactly how your data varies.
As a testament to the popularity of FusionCharts, its client base has over 800,000 developers in more than 28,000 organizations worldwide. These organizations IBM, Oracle, Vmware, Adobe, and Apple, just to name a few.
Read on to find out the important aspects of FusionCharts responsive and interactive live data streaming charts. Learn more about features like its real-time message logger, alert manager, interactive legends, and context menus.
Table of Contents
What is a Live Chart?
Live charts automatically update themselves at intervals that you control. Also called real-time or data streaming charts, they update by fetching data directly from your server without a browser refresh.
What Different Types of Live Charts does FusionCharts Support?
FusionCharts supports six different types of real-time charts. These include:
- Line Charts
- Area Charts
- Column Charts
- Stacked Area Charts
- Stacked Column Charts
- Dual Y-Axis Line Charts
1. What are Real-Time Line Charts?
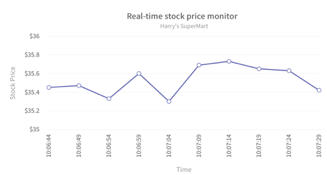
Real-time line charts show how a dependent variable changes with the values of the independent variable. A prime example of this is the fluctuations of a stock price chart over a month or a year.
2. What are Real-Time Area Charts?
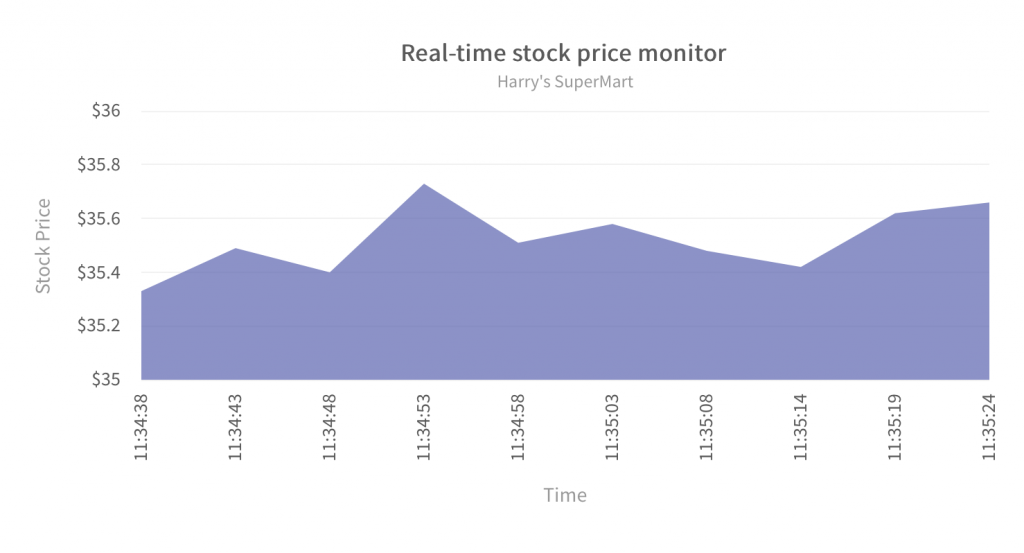
Similar to line charts, real-time area charts also show changes in the dependent variable over time.
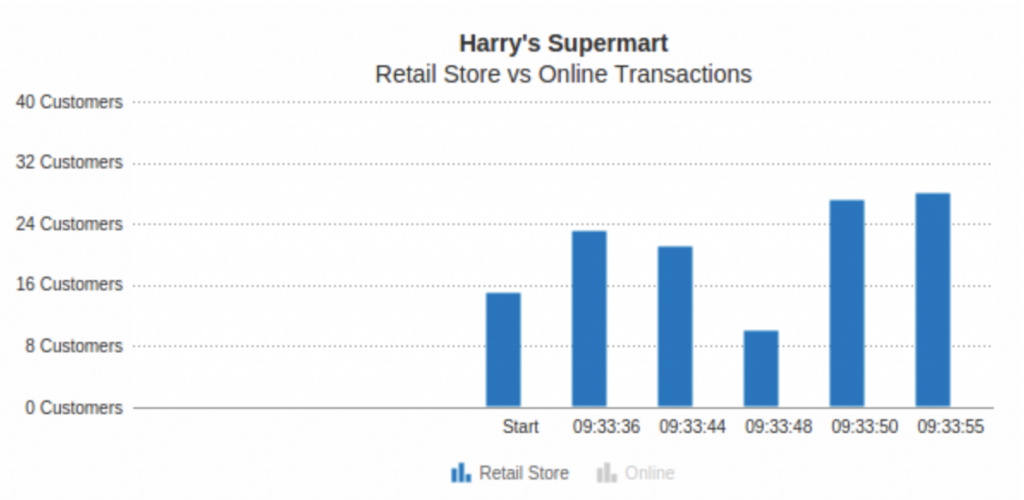
3. What is a Real-Time Column Chart?
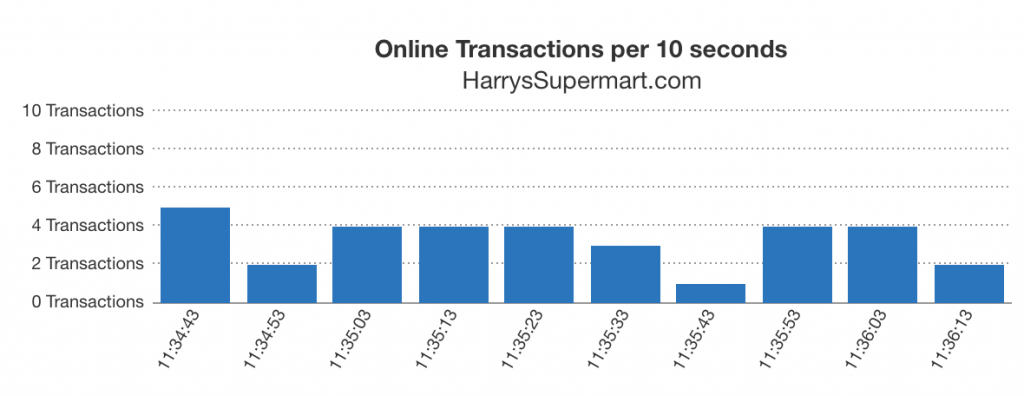
In addition to line and area charts, real-time column charts are a means of comparing several variables and data values as they vary over time.
4. What is a Real-Time Stacked Area Chart?
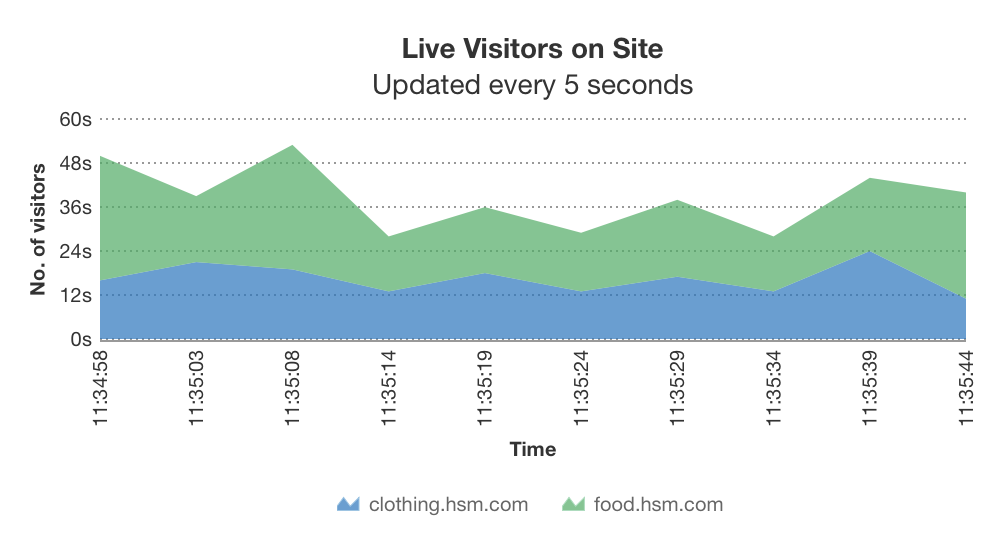
Stacked area charts show multiple area charts, stacked on top of each other and corresponding to multiple datasets. The real-time version of this chart updates itself over time.
5. What are Real-Time Stacked Column Charts?
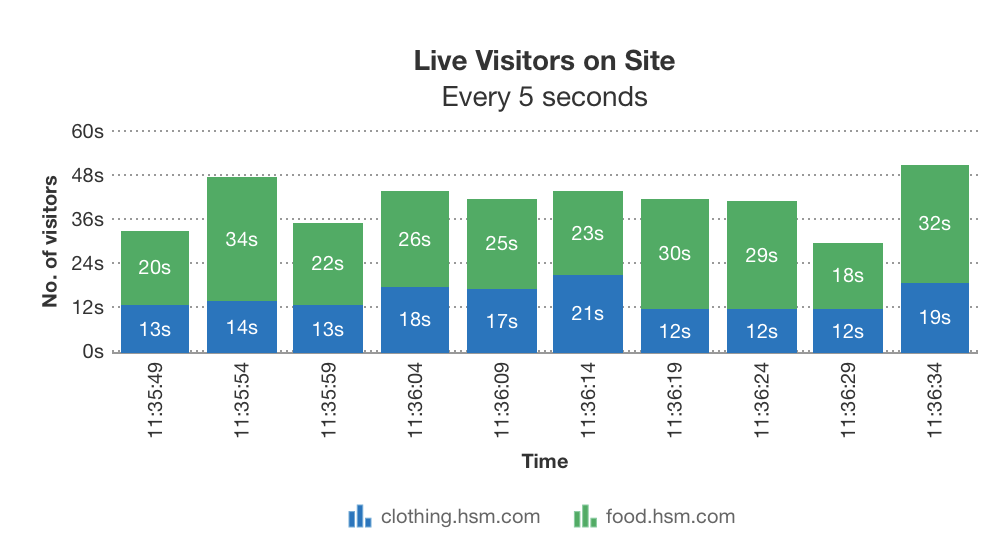
You can use Real-time stacked column charts to compare different data values belonging to different categories. They present the breakdown of each item placed on top of each other. These charts also autonomously update to show real-time variations in your data.
6. What is a Real-Time Dual Y-Axis Line Chart?
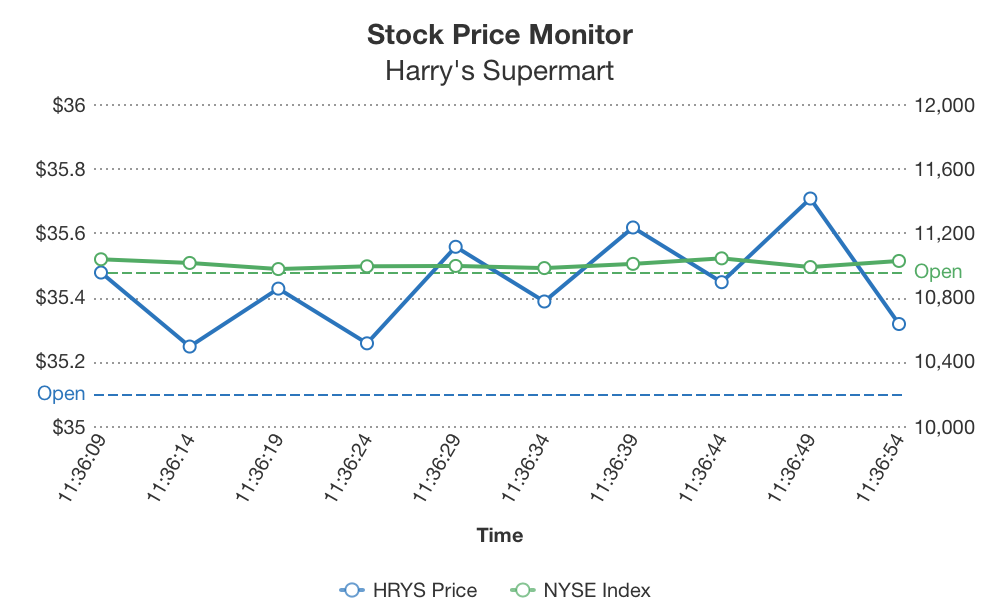
Finally, real-time dual-line charts have two y-axes to compare how a pair of variables vary together as time passes.
What are the Features of FusionCharts Live Charts?
FusionCharts offers several live charting options. Here are a few use cases.
Real-Time Updates of Multiple Datasets and Multiple Data Values
When you create live charts with multiple datasets in FusionCharts, you choose how and when your chart updates. A single call to the server returns a response that updates multiple data values.
Define Update Interval and Refresh Intervals
With FusionCharts, you can define the update interval as well as the refresh interval. The update interval fetches new data without updating the chart view. The refresh interval updates the chart with the latest fetched data.
Real-Time Message Logger and Alert Manager
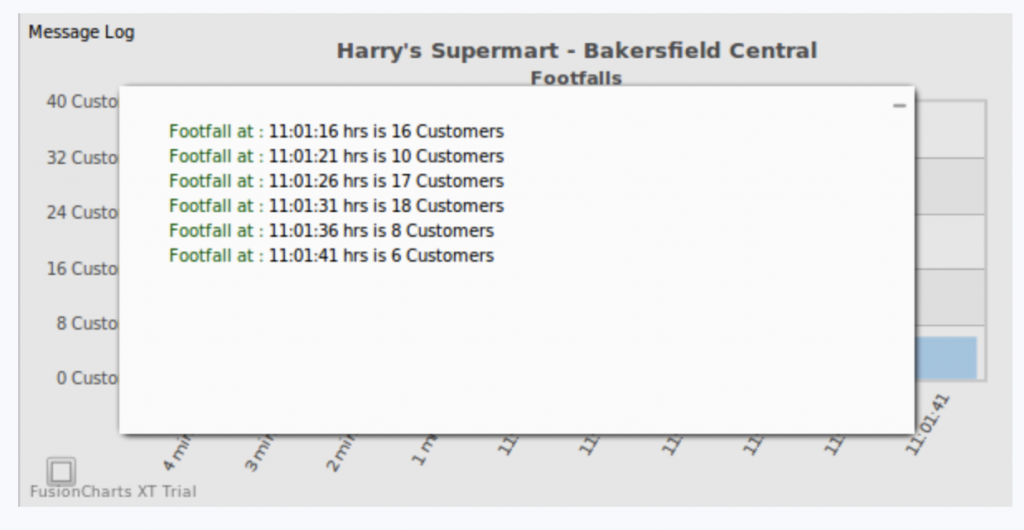
With FusionCharts live charts you can write your own message logger as well as an alert manager. With the message logger, you can show real-time messages within a specialized chart window. The alert manager helps you define actions based on the data points reaching critical values in pre-defined ranges.
Create Custom Annotations in Live Charts That Update in Real-Time
With FusionCharts, you can create custom annotations that update in real-time based upon different ranges of data values.
Define Event Handlers for Different Real-Time Events
In FusionCharts your developers can capture different events in real-time and either write customized handlers or stick to the default behavior. For example, you can define actions on events like chart initialization, chart rendering, and data updates.
Show Or Hide Data Series with Interactive Legends
With an interactive legend in real-time charts, your users can choose to show a particular data series while hiding the rest. They can also highlight one series in the context of the rest.
Real-Time Vertical Division Lines and Trend-Lines
With this powerful feature, your users compare data points against a vertical trend-line or benchmark. Alternatively, you can define a horizontal trend-line to let the users focus on a specific area within the data.
Enable or Disable Real-Time Updates with Context Menus
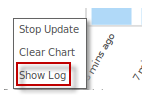
With live charts created using FusionCharts, a context menu is displayed at the bottom left corner of the graph. Along with other options, you can switch automatic updates on or off using this menu.
Changing the Look and Feel of Real-Time Charts
You can customize everything from number formatting to chart colors, text, and captions in all live charts created via FusionCharts.
How Do I Sign Up For FusionCharts to Create Live Charts?
FusionCharts is a beautiful Javascript library for data visualization and presentation. There are 100+ charts, graphs and gauges along with 2000+ choropleth maps to choose from. The real-time charts and graphs allow you to create responsive and interactive live charts that update themselves.
Make the most of your data now. Download the free FusionCharts Suite XT trial today and create your first FusionCharts data visual.
