Data visualization is critical to the success of both small and large businesses. It can help you improve your planning process and boost productivity by presenting data and outcomes like employee performance reports and vital corporate insights. When your data is massive, this is the greatest approach to communicate. Using visual components – like JavaScript pie charts, graphs, and maps – data visualization tools make it simple to explore and grasp trends, outliers, and patterns in data. To provide your firm with a much-needed boost, you’ll require a professional and reliable JavaScript chart library.
Every organization and business has distinct data needs that a mundane JavaScript timeline chart or JavaScript bar chart cannot fulfill. Therefore, there needs to be a credible and trustworthy JavaScript Charting Library. In this digital era, it is becoming increasingly important to present data efficiently. This helps organizations and businesses progress further and analyze the competition. Read on to find out more about JavaScript charting libraries and how you can choose the best JavaScript charting libraries to represent your data effectively.
Table of Contents
What Makes FusionCharts Stand Out As The Best JavaScript Charting Library?
You need to go no further if you’re seeking the next game-changing charting library. FusionCharts is the ideal partner for you. It’ll meet all your data visualization requirements. It includes a dynamic and responsive JavaScript stock chart and candlestick chart that appeal to the audience and are sure to catch their attention at first sight. FusionCharts also features a uniform API, cross-browser compatibility, and a comprehensive reference guide.
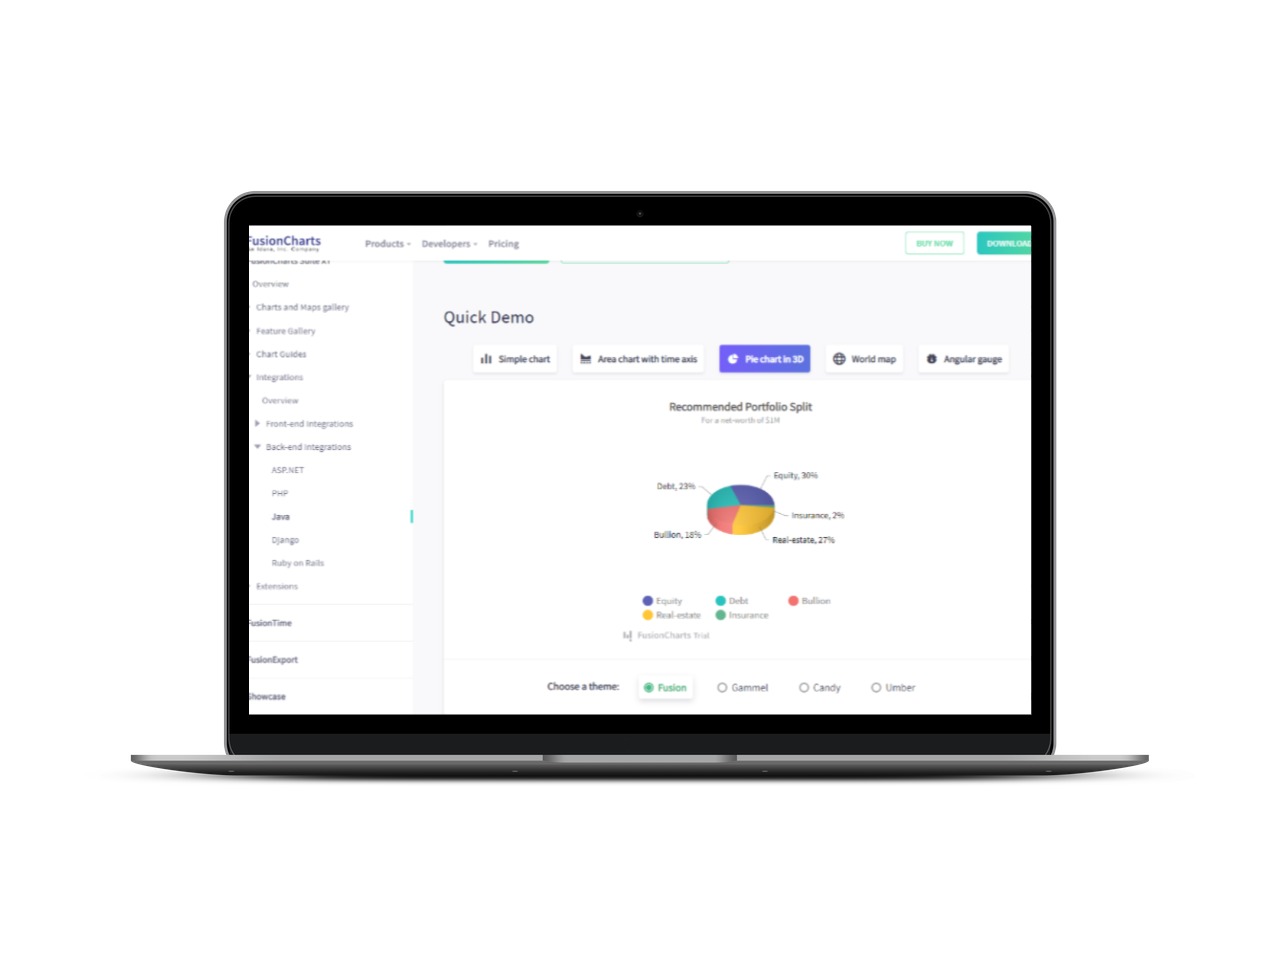
FusionCharts has a number of choices for generating an eye-catching open-source JavaScript chart. One of the most crucial parts of successful data visualization is variety; you should have a number of templates and charts available, so you can choose the one that best meets your needs. With over 2000 choropleth maps and over 100 JavaScript candlestick charts, graphs, and gauges, FusionCharts is unparalleled in this domain. If you add a bar, column, or pie chart, your data will be very interactive and aesthetically pleasing to the viewer. Treemaps and Gantt charts are among the domain-specific charts included in FusionCharts. We definitely recommend using FusionCharts as it is our top choice on the list of best JavaScript charting libraries.
What is Charts.js?
Charts.js is a wonderful and compact JavaScript library that is a viable option for users who want something smart and simple. It contains a plethora of charts, ranging from scatter plots and area charts to mixed and bubble charts. The samples have a contemporary appearance; therefore, they include the initial animations created while sketching for the first time. Time series can also be used. It renders using the canvas element and is responsive to window resizing to maintain scale granularity. Internet Explorer 9 is backward compatible. Polyfills for Internet Explorer 7 is also available. It is free and it features charts that can be easily animated and modified. In addition to this, the resulting Java charts are also highly interactive and support numerous plugins with extensive documentation.
Why is Dygraphs Popular for its Speed?
Dygraphs is an open-source charting library often praised for its quick speed and efficient data handling. It can easily handle massive amounts of data. Using this JavaScript framework, data analysts can manage enormous data sets while offering a decent user experience. It allows for the synchronization of numerous charts. Therefore, it is an excellent tool for displaying real-time data. It is also optimal for beginners as it lacks advanced functionality and therefore is quite simple to use. You can also choose between displaying data in real-time or displaying data off-chart. In addition to this, users can carry out quick data manipulation with efficiency. The only drawback is that it is not as efficient and full of functionality when compared to FusionCharts. It only supports line and multi-line charts compared to FusionChart’s hundreds of variations.
What is Recharts?
Recharts is a wonderful and composable JavaScript charting library that you can use in absence of FusionCharts. It is built on top of SVG elements; therefore, it is lightweight and reliable. Recharts use D3 behind the hood and expose declarative components. It’s free, open-source, and uses SVG components to create gorgeous, interactive charts. It’s easy to use, and the documentation is enjoyable to read.
It comes with built-in chart features like legend tooltips and labels, and works well with static charts. It can be slow when dealing with several animated charts on the same page and huge datasets, but it will serve in most cases. Users can easily create reusable charts with Recharts. In addition to this, they can conveniently customize and animate their own charts by adding components of their own choice. Currently, it supports line, bar, pie, and area charts.
Why is FusionCharts Functionally Superior?

In terms of data visualization, no tool comes close to FusionCharts. We believe it is one of the best JavaScript charting libraries. In terms of usability and value for money, it outperforms all other market choices. You can create your own theme with a consistent and stunning appearance and feel. It also offers a variety of installation alternatives, including straight JavaScript and NPM. You may always turn to their excellent support system and substantial documentation if you have any questions or technical issues. FusionCharts provides you with access to a library of thousands of amazing pre-built charts.
It’s a fantastic data visualization library that constantly prioritizes the needs of its clients. Because APIs are provided, it is insanely easy to use and create attractive presentations.
Let’s face it, you don’t deserve mediocrity, so FusionCharts should be your next data visualization library of choice. FusionCharts has a multitude of installation options (direct JavaScript, CDN, NPM) and is pre-integrated with all popular JavaScript libraries and back-end programming languages, as well as extensive documentation to assist you in the event of a malfunction or system error.
Ready to start building amazing JavaScript charts with one of the best libraries?
FusionCharts is famous for its world-class technical support. Help is essential whenever a user becomes stuck or requires an explanation of a policy or function, since a disgruntled customer is not a happy customer. After FusionCharts is installed, you won’t have to worry about anything since you’ll get world-class support to help you show your data.
So what are you waiting for? Join us now to visualize your data effectively!
