Business dashboards add intrinsic value to businesses’ day-to-day operations and future decision-making. Data visualization techniques are used in these dashboards to summarize large amounts of data and present it in a simple and meaningful format. They play an important role in assisting all executives, managers, and CEOs in managing and tracking day-to-day operations, understanding current trends, and forecasting future values in order to make informed and educated decisions.
You will greatly improve and enrich your end users’ data visualization experience by using FusionCharts. In terms of data presentations, efficiency, ease of use, and powerful data visualizations, FusionCharts is a superior graphing and charting library.
In this post, we’ve compiled a list of 12 useful tips to help you create dynamic and robust business dashboards. All of these fundamental principles can be incorporated into your dashboards. Let’s get started!
Table of Contents
Tip 1: Build the Dashboard With the Right Set of Charts
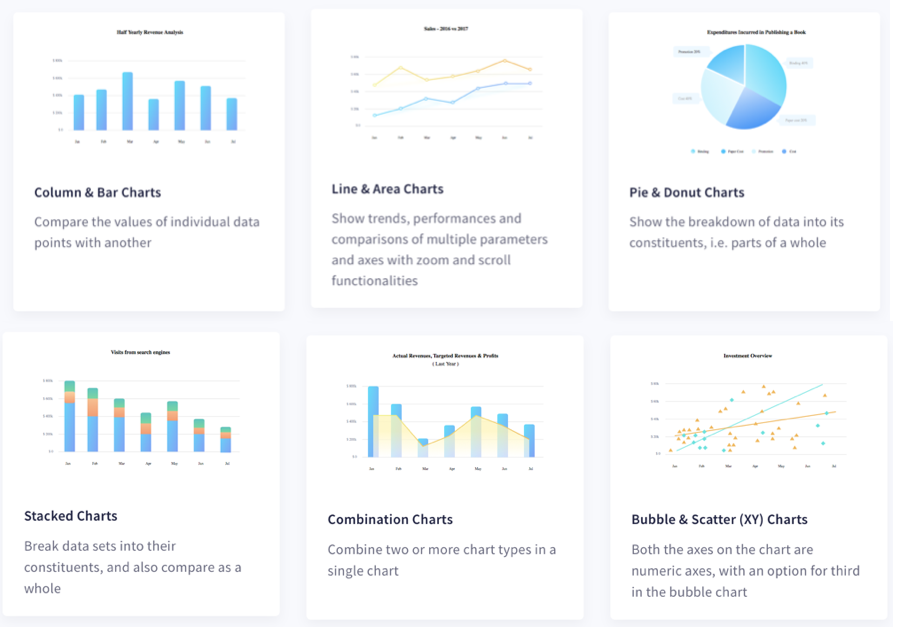
When you create a dashboard, you need to ensure that you display each set of metrics with the most relevant chart. When your independent variable is discrete, a bar or column chart is best. If you have continuous (X,Y) pairs, line or scatter plots rule. FusionCharts ships with 100+ charts and graphs and 2000+ data-driven maps so you can select the right chart for your data. For a detailed discussion, you can consult the white paper on selecting the right chart type for your data.
Tip 2: Create Responsive Business Dashboards
All your dashboards should be responsive to user actions. FusionCharts is one of the very few charting libraries that allows you to write event handlers for all types of chart events including mouse and keyboard events.
Tip 3: Add Interactive Legends
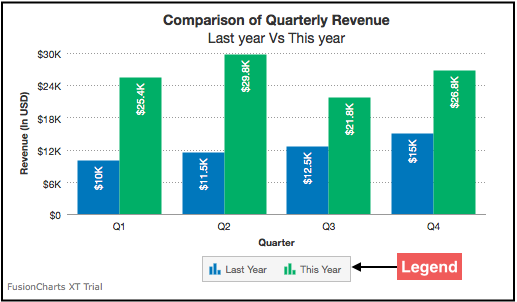
It’s always a good idea to add legends in the charts or graphs on your dashboard. However, at times legends can be distracting, especially when regular users get familiar with what they represent. With interactive legends, your user decides.
FusionCharts has an awesome interactive legend feature that your users can choose to turn off entirely. They can also hide a particular data series and focus on the remaining data points of interest.
Tip 4: Update Business Dashboard in Real-Time
A dashboard should not be a static entity. As your data updates, so should your dashboard. With FusionCharts, you can make real-time dashboards to monitor your most important indicators.
FusionCharts supports real-time or data streaming charts. These automatically update themselves in real-time at user-specified intervals. That means you don’t even need to refresh the page.
Tip 5: Dashboard Should Narrate Your Data Story
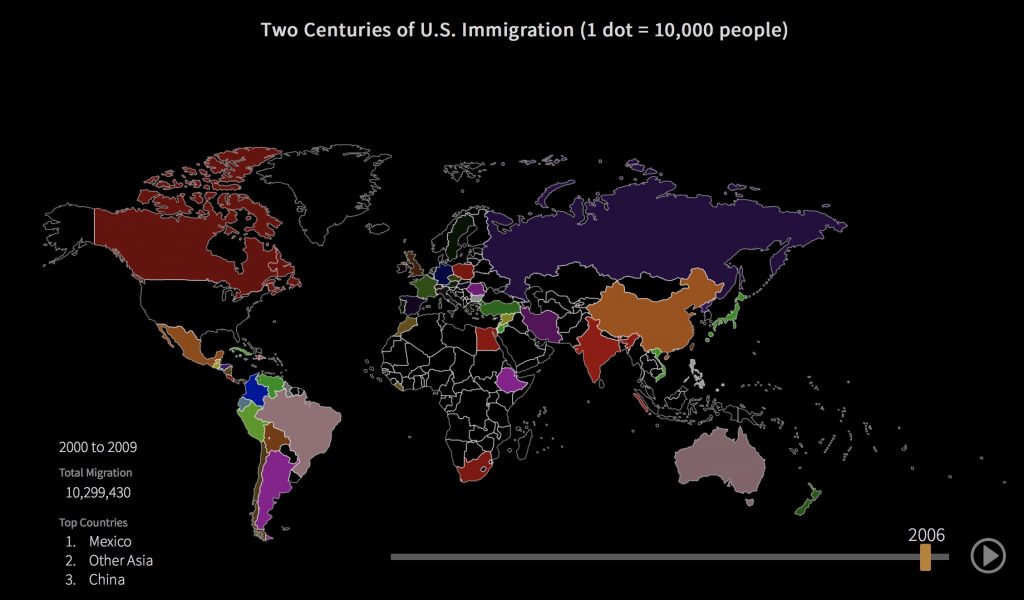
You can narrate an entire data story with the help of dashboards. Using interactive visuals, you can add expressive charts to your business dashboard that not only give an overall bird’s eye view of the data but also give your users a deeper understanding of your data points. For more information, you can explore compelling stories with your data.
Tip 6: Add Drill-Downs to Charts
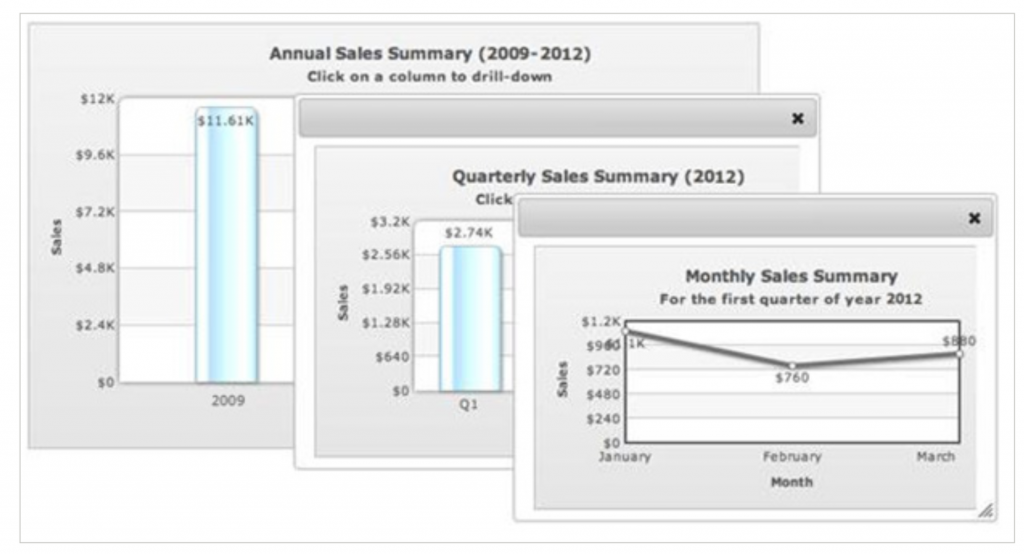
All the charts in your dashboard should support drill-downs to show your data’s finer details. A drill-down allows each data point or chart entity to be interactive and also act as a hot spot.
You can use FusionCharts to easily add drill-down interactivity. FusionCharts provides several different chart options. These include adding interactivity for pie slices in pie charts, making the columns in a column chart respond to user actions, and more.
Tip 7: Include Panning, Zooming and Scaling
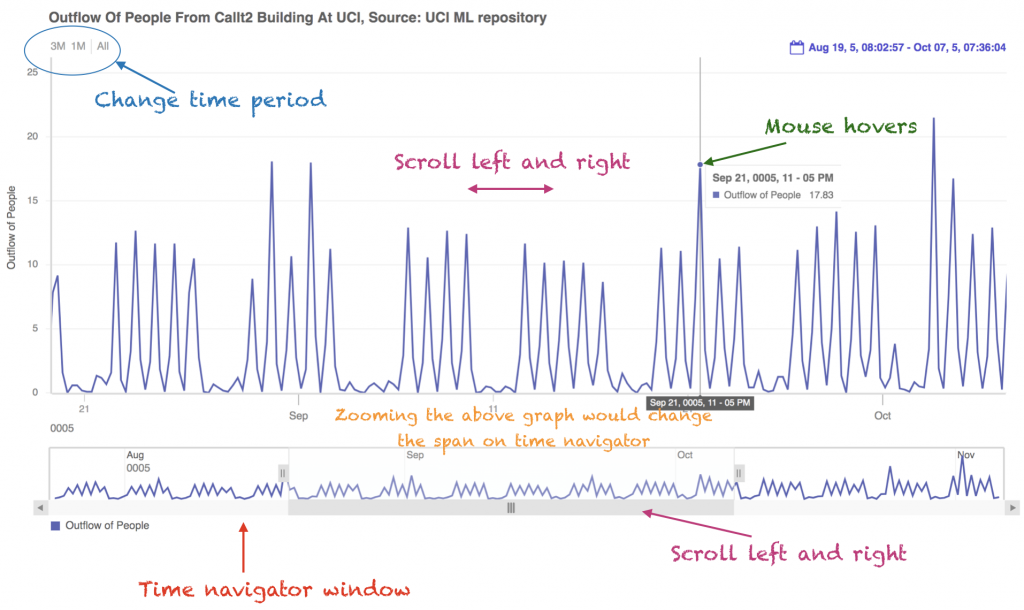
When it comes to visualizing large datasets, panning, zooming and scaling are important features your dashboard needs. FusionCharts offers numerous options for these 3 features. These include zooming via mouse interaction, panning via switching to pin mode, and scrolling to a position by entering a date range.
Tip 8: Add Relevant and Descriptive Captions
One of the main ways of increasing the usability of your dashboards is to add descriptive captions and sub-captions. With FusionCharts everything on a chart can be customized. This allows you to add your own caption, sub-caption, axis titles, data labels, and more.
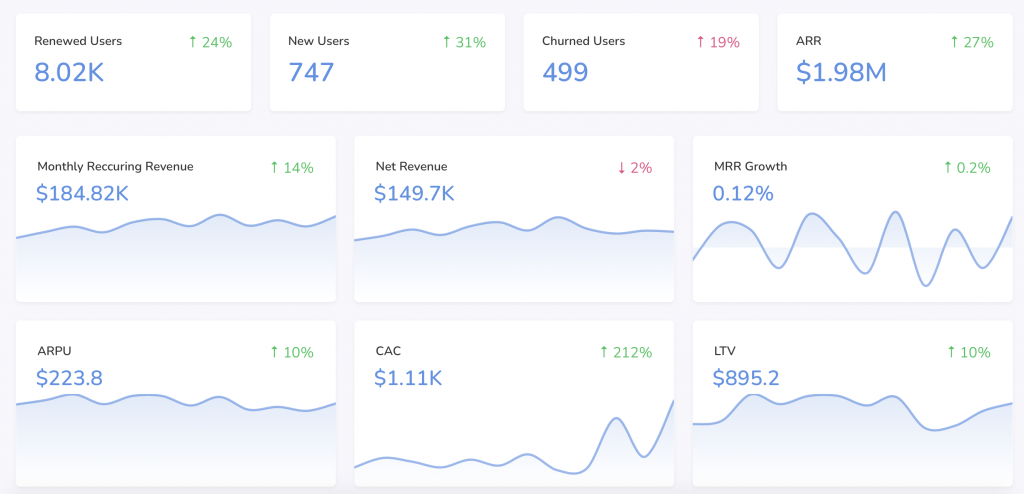
Tip 9: Round-Off Numbers to Avoid Unnecessary Precision
Another important principle for maximizing the usability of your charts is to avoid unnecessary precision when adding numbers as labels. For example, an annual profit value of $4,391,215 should be shown as $4.40M for better readability and comprehension. FusionCharts has types of number formatting options. For instance, you can add number prefixes, number suffixes, perform recursive number scaling as well as specify number formats, and more.
Tip 10: Add Trendlines to Interpret Data
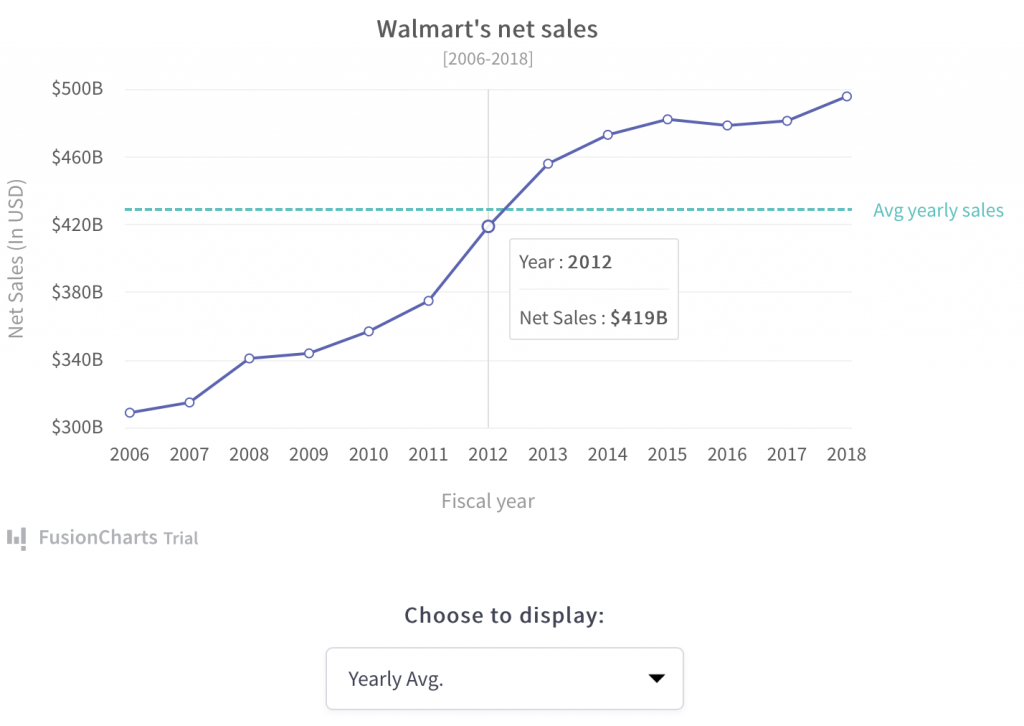
Trendlines are reference lines placed horizontally or vertically in a chart for comparison and data interpretation. For example, you can indicate a goal using a trendline and then plot the rest of the data along with it. FusionCharts lets you specify not only trendlines but also lets you define trend zones using a range of values.
Tip 11: Add and Configure Tooltips
Tooltips also add more value to charts and graphs on a dashboard by displaying contextual information related to particular data plots or data points. Use FusionCharts to configure different types of tooltips on your dashboard. You can also use the default setting for the tooltips.
Tip 12: Add Options to Export Your Dashboard
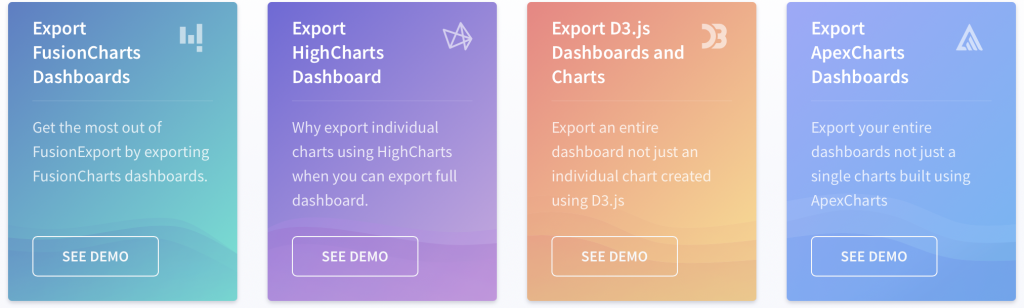
A dashboard should enable you to share and disseminate information. For example, you can add productivity by taking snapshots of a business dashboard and circulating it among managers and colleagues. Not all charting libraries provide this facility. You can also rely on FusionExport to export your entire dashboard as a .jpg, .png, .pdf or another image format. In this way, you can easily share email compatible formats with users who don’t have direct access to the dashboard.
Why Use FusionCharts For Building Business Dashboards?
FusionCharts is a beautiful library for data visualization and building dashboards. It is also trusted by over 800,000 developers across 28,000 companies. FusionCharts is especially popular with data scientists and developers. Its client base includes IBM, Apple, Intel, Adobe as well as Oracle and more.
The FusionCharts library enriches your end user’s dashboard experience with beautiful, effective, and meaningful data presentations.
Don’t delay. Explore more of FusionCharts features and sign up for your free FusionCharts trial today!
