Generating financial reports is one thing. Being able to utilize those reports to inform sound decision-making processes is another. The key to effectively leveraging financial reports to make informed business decisions is accurately visualizing up-to-date information and explaining variances in numbers. This is where a financial dashboard plays a critical role. From cash flow and monthly revenue to expenses and investments, financial dashboards can display everything in one view. There are many financial dashboard examples that businesses can mirror for effective financial management. This article discusses the four best financial dashboard examples you can quickly implement for your financial reporting.
But before diving in, we should go over what a financial dashboard entails and its key features.
Table of Contents
Financial Dashboard
A financial dashboard is a data visualization tool that:
- Collects your raw financial data
- Merges all relevant to your financial goals
- Displays it in a visually compelling manner and one view
This makes it easier for stakeholders and decision-makers to analyze and understand financial data through easy-to-understand visual representations. Thereby, it simplifies and speeds up the decision-making processes, ultimately making business operations agile. If needed, financial dashboards can track KPIs relative to your predefined goals. These KPIs can be useful in financial reporting or critical decision-making.
What’s more, financial dashboard examples and templates are easily customizable. In other words, you can adapt existing templates to suit your organization’s goals, objectives, and branding. A finance dashboard is a great tool that eliminates the difficulty of analyzing financial data while saving time and money.
Key Features Needed
While dashboards’ customizability allows you to add features that suit your goals, below are some key features you should have:
Visual Representation
The ability of a financial dashboard to simplify financial data is, in large part, due to the visual representation features. The human brain easily processes visual information. Therefore, to achieve the purpose of a finance dashboard, you must include graphs, tables, and charts that accurately tell your data’s story.
Intelligent Analysis Tools
Analytical tools transform data into insights that can guide future choices. Without them, you’re not actively putting your data to use. Finance dashboards should have various analytical tools that compute significant business outcomes.
Accurate Predictions
While gaining insights and understanding past and current financial data is great, predicting future trends and plans is essential for the financial dashboard. In this case, predictions should be another key financial dashboard feature. Include accurate projections that can inform critical decision-making in the future.
Automatic Data Transfers
The last key feature on our list is automatic data transfer. This is important to fulfill the full potential of a finance dashboard. Automatic data transfers save time and allow you to focus on core business areas.
Building A Financial Dashboard
Follow the below steps on how to build a financial dashboard.
Define Your Target Goals and KPIs
Defining your goals, objectives, and KPIs is the first step toward building your financial dashboard. It isn’t advisable to begin a journey without knowing your destination. The goals or objectives from a financial standpoint are a great starting point if you use a balanced scorecard. This provides a straightforward approach to tracking your revenues, profits, and expenses. However, since they provide information about events from the previous month or quarter, most of the metrics in this perspective lag indicators.
Identify The Financial Metrics
Metrics that offer a comprehensive perspective of your company’s financial health should be displayed on your dashboard. While these are specific to every organization, it’s common to see metrics like revenue, cash flow, and profit. That said, consider the following points when deciding on dashboard metrics.
- Don’t show excess data. Keep it simple, while giving the option to get more specific if necessary
- Rather than only displaying the numbers, summarize and explain them
The end goal here is to provide value to your audience. So, take your audience into account. Answer questions like — Who will be viewing this dashboard? What figures are important to them? And other end-user-related questions.
Design and Build Your Own Custom Dashboard
This is where you choose a design for your custom dashboard. Ensure your designs present your dashboard in an easy-to-understand and visually compelling manner.
Visual tools like charts and graphs are common dashboard elements. As discussed earlier, we are visual creators. This means we can quickly understand and analyze months of financial data with charts and graphs.
There are numerous financial dashboard examples, some of which designs you can incorporate.
Get Insights and Identify Trends
A financial dashboard should act as a thermometer for your organization’s financial health. Depending on the metrics you employ, some may be better suited to highlighting long-term patterns, while others may only provide insight into a certain accounting period. Additionally, you ought to set goals for your actions. This way, you can easily track your performance and make informed decisions.
For more insights, check out: How To Master Financial Dashboards in 6 Simple Steps
Financial Dashboard Examples
Financial dashboards enable you to track all your financial KPIs and ensure effective financial management. Below is a financial dashboard example list.
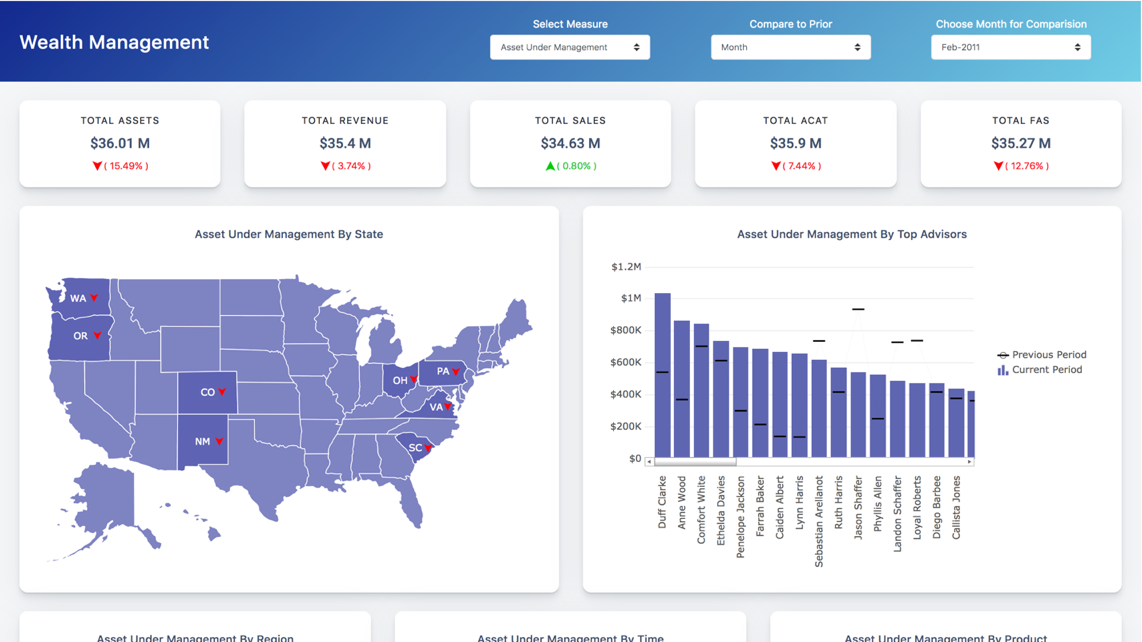
CFO Dashboard
A Chief Financial Officer uses a CFO dashboard to have a better overview of the company’s financial health and overall performance. It helps them maintain operational oversight and plan for future eventualities that could benefit the company. You can easily use a financial dashboard template to create one.
Financial KPI Dashboard
A financial KPI dashboard focuses on the current working capital, consisting of your existing assets and liabilities. Working capital helps to guide whether to invest or not. If the working capital is high, you have the potential to invest and grow. Also, it is sometimes referred to as a financial performance dashboard.
Profit And Loss Dashboard
This financial dashboard helps users to understand the income statement from revenue to net profit, enhanced by relevant performance ratios. The finance dashboard centers around four important financial indicators:
- Gross profit margin
- OPEX ratio
- Operating profit margin
- Net profit margin
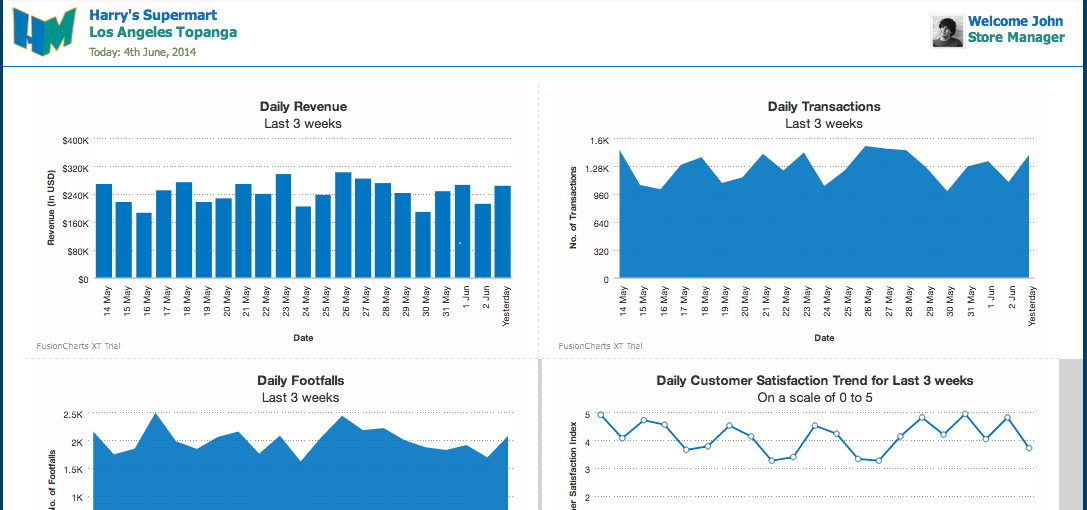
Revenue Dashboard
A revenue dashboard helps to understand company revenue, so users can clearly see the different factors driving revenue changes. The revenue change can be due to:
- New customers
- Cancellations
- Upgrades to a higher-priced plan
- Downgrades to a lower-priced plan
- Dormant customers who have reactivated their accounts.
It shows every aspect separately, so users know the context behind changes to the primary KPI.
Conclusion
Over the past few years, dashboards have emerged as the “holy grail” of financial management. Yet, many organizations are unsure if they should incorporate financial dashboards or not. However, if financial reporting is tedious and time-consuming or an administrative headache, then dashboards are what you need to energize your business operations.
FusionCharts offers unique financial dashboard example templates that you can quickly incorporate into your project. Explore for yourself!