Gantt charts are wonderful things. They provide a visual view of tasks scheduled over a period of time. Because they are so versatile and informative, Gantt charts are the go-to chart for planning projects of all sizes. They are an especially useful way of showing what work is scheduled to be done on a specific day. They also help you view the start and end dates of a project in one simple view. On the left of the chart is a list of the activities and along the top is a suitable time scale. Each bar represents an activity — the position and length of the bar reflect the start date, duration, and end date of the activity.
In this article, we are going to explore five different ways that you can configure a Gantt chart to display various kinds of task data. We are going to look at how you can display your weekly task distribution, hourly tasks, milestone indicators, dependent tasks, and machine operating schedules. Our examples are in JavaScript using the FusionCharts library.
If you didn’t know already, FusionCharts is a powerful JavaScript library for building visually stunning data charts. You will see that the data for the charts is also defined in the JavaScript as JSON. The actual Javascript code for setting up and displaying the charts is very minimal.
Let’s get started!
Table of Contents
How can I build a weekly task distribution Gantt chart?
Javascript:
const dataSource = {
  chart: {
    caption: "Weekly Maintenance Checks for Denver Plant",
    subcaption: "Sun Industries",
    dateformat: "mm/dd/yyyy hh:mm:ss",
    outputdateformat: "ddds mnl, yyyy hh12:mn ampm",
    theme: "fusion",
    plottooltext: "<b>$label</b><br>Start: <b>$start</b><br>End: <b>$end</b>"
  },
  tasks: {
    showlabels: "0",
    color: "#5D62B5",
    task: [
      {
        processid: "MC7",
        start: "04/02/2018 12:00:00",
        end: "04/02/2018 23:00:00",
        label: "11 Hrs"
      },
      {
        processid: "MC7",
        start: "04/04/2018 12:00:00",
        end: "04/04/2018 23:00:00",
        label: "11 Hrs"
      },
      {
        processid: "MC7",
        start: "04/06/2018 12:00:00",
        end: "04/06/2018 23:00:00",
        label: "11 Hrs"
      },
      {
        processid: "MC6",
        start: "04/02/2018 8:00:00",
        end: "04/02/2018 16:00:00",
        label: "8 Hrs"
      },
      {
        processid: "MC6",
        start: "04/07/2018 8:00:00",
        end: "04/07/2018 16:00:00",
        label: "8 Hrs"
      },
      {
        processid: "MC5",
        start: "04/04/2018 10:00:00",
        end: "04/04/2018 23:00:00",
        label: "13 Hrs"
      },
      {
        processid: "MC4",
        start: "04/03/2018 13:30:00",
        end: "04/03/2018 22:30:00",
        label: "9 Hrs"
      },
      {
        processid: "MC4",
        start: "04/06/2018 13:30:00",
        end: "04/06/2018 22:30:00",
        label: "9 Hrs"
      },
      {
        processid: "MC3",
        start: "04/05/2018 11:30:00",
        end: "04/05/2018 22:30:00",
        label: "11 Hrs"
      },
      {
        processid: "MC2",
        start: "04/07/2018 13:30:00",
        end: "04/07/2018 23:30:00",
        label: "10 Hrs"
      },
      {
        processid: "MC1",
        start: "04/04/2018 11:45:00",
        end: "04/04/2018 23:45:00",
        label: "12 Hrs"
      }
    ]
  },
  processes: {
    align: "left",
    headertext: "Tasks",
    headervalign: "middle",
    headeralign: "left",
    process: [
      {
        label: "Bedplate Latch Bolts",
        id: "MC1"
      },
      {
        label: "Bedplate Hydraulic Hoses",
        id: "MC2"
      },
      {
        label: "Dust Stops Leakage",
        id: "MC3"
      },
      {
        label: "Mixing Chamber Oiling",
        id: "MC4"
      },
      {
        label: "Latch Stroke",
        id: "MC5"
      },
      {
        label: "Latch Cylinder Leakage",
        id: "MC6"
      },
      {
        label: "Latch Fastener Tightness",
        id: "MC7"
      }
    ]
  },
  categories: [
    {
      category: [
        {
          start: "04/02/2018 00:00:00",
          end: "04/02/2018 23:59:59",
          label: "Monday"
        },
        {
          start: "04/03/2018 00:00:00",
          end: "04/03/2018 23:59:59",
          label: "Tuesday"
        },
        {
          start: "04/04/2018 00:00:00",
          end: "04/04/2018 23:59:59",
          label: "Wednesday"
        },
        {
          start: "04/05/2018 00:00:00",
          end: "04/05/2018 23:59:59",
          label: "Thursday"
        },
        {
          start: "04/06/2018 00:00:00",
          end: "04/06/2018 23:59:59",
          label: "Friday"
        },
        {
          start: "04/07/2018 00:00:00",
          end: "04/07/2018 23:59:59",
          label: "Saturday"
        }
      ]
    }
  ]
};

FusionCharts.ready(function() {
  var myChart = new FusionCharts({
    type: "gantt",
    renderAt: "chart-container",
    width: "100%",
    height: "100%",
    dataFormat: "json",
    dataSource
  }).render();
});
HTML:
<div id="chart-container"></div>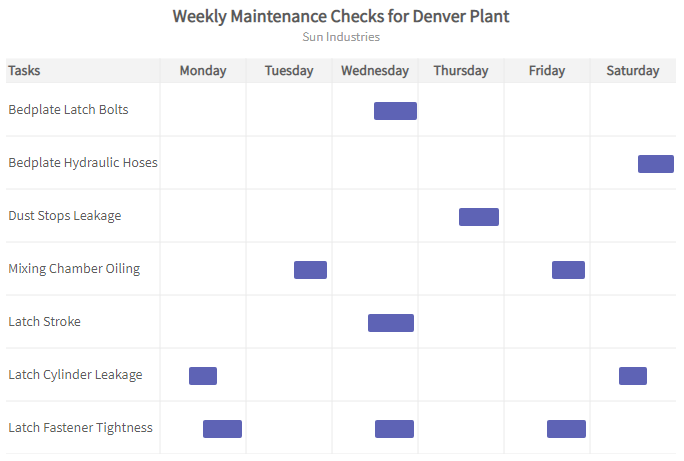
How can I build an hourly tasks Gantt chart?
Javascript:
const dataSource = {
  tasks: {
    showlabels: "1",
    color: "#5D62B5",
    task: [
      {
        processid: "EMP120",
        start: "07:00:00",
        end: "16:00:00",
        label: "Morning Shift"
      },
      {
        processid: "EMP121",
        start: "14:00:00",
        end: "22:00:00",
        label: "Afternoon Shift"
      },
      {
        processid: "EMP122",
        start: "14:00:00",
        end: "18:30:00",
        label: "Half Day"
      },
      {
        processid: "EMP123",
        start: "07:00:00",
        end: "16:00:00",
        label: "Morning Shift"
      },
      {
        processid: "EMP124",
        start: "14:00:00",
        end: "22:00:00",
        label: "Afternoon Shift"
      },
      {
        processid: "EMP125",
        start: "00:00:00",
        end: "08:00:00",
        label: "Early Morning support"
      },
      {
        processid: "EMP126",
        start: "07:00:00",
        end: "11:30:00",
        label: "Half Day"
      }
    ]
  },
  processes: {
    fontsize: "12",
    isbold: "1",
    align: "Center",
    headertext: "Employee",
    headerfontsize: "14",
    headervalign: "middle",
    headeralign: "left",
    process: [
      {
        label: "Betty",
        id: "EMP120"
      },
      {
        label: "William",
        id: "EMP121"
      },
      {
        label: "Emma",
        id: "EMP122"
      },
      {
        label: "Oliver",
        id: "EMP123"
      },
      {
        label: "Lucas",
        id: "EMP124"
      },
      {
        label: "Alex",
        id: "EMP125"
      },
      {
        label: "John",
        id: "EMP126"
      }
    ]
  },
  categories: [
    {
      category: [
        {
          start: "00:00:00",
          end: "23:59:59",
          label: "Time"
        }
      ]
    },
    {
      align: "center",
      category: [
        {
          start: "00:00:00",
          end: "02:59:59",
          label: "Midnight"
        },
        {
          start: "03:00:00",
          end: "05:59:59",
          label: "3 AM"
        },
        {
          start: "06:00:00",
          end: "08:59:59",
          label: "6 AM"
        },
        {
          start: "09:00:00",
          end: "11:59:59",
          label: "9 AM"
        },
        {
          start: "12:00:00",
          end: "14:59:59",
          label: "12 PM"
        },
        {
          start: "15:00:00",
          end: "17:59:59",
          label: "3 PM"
        },
        {
          start: "18:00:00",
          end: "20:59:59",
          label: "6 PM"
        },
        {
          start: "21:00:00",
          end: "23:59:59",
          label: "9 PM"
        }
      ]
    }
  ],
  chart: {
    dateformat: "dd/mm/yyyy",
    outputdateformat: "hh12:mn ampm",
    caption: "Shift Roster for June",
    subcaption: "Customer Success Team<br>Sensibill",
    ganttpaneduration: "22",
    ganttpanedurationunit: "h",
    scrolltodate: "09:00:00",
    useverticalscrolling: "0",
    theme: "fusion"
  }
};

FusionCharts.ready(function() {
  var myChart = new FusionCharts({
    type: "gantt",
    renderAt: "chart-container",
    width: "100%",
    height: "100%",
    dataFormat: "json",
    dataSource
  }).render();
});
HTML:
<div id="chart-container"></div>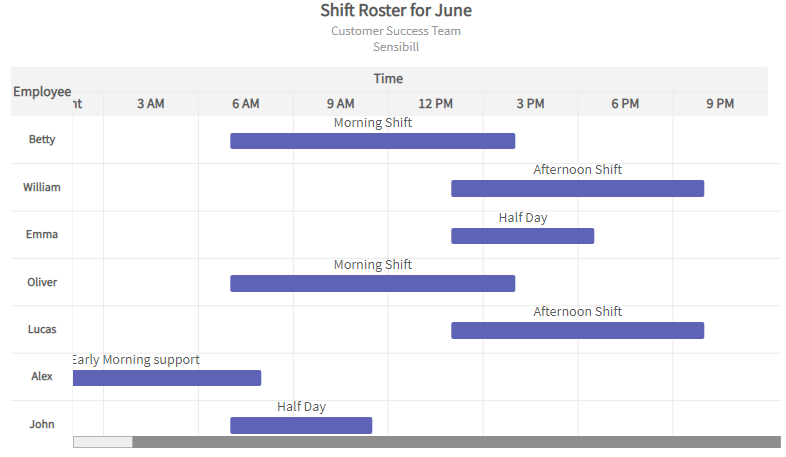
How can I build a milestone indicators Gantt chart?
Javascript:
const dataSource = {
  chart: {
    dateformat: "mm/dd/yyyy",
    theme: "fusion",
    useverticalscrolling: "0"
  },
  datatable: {
    headervalign: "bottom",
    datacolumn: [
      {
        headertext: "Owner",
        headervalign: "bottom",
        headeralign: "left",
        align: "left",
        text: [
          {
            label: "Product Team"
          },
          {
            label: "Marketing Team"
          },
          {
            label: "Product Team"
          },
          {
            label: "Dev Team"
          },
          {
            label: "Design Team"
          },
          {
            label: "Dev Team"
          },
          {
            label: "QA Team"
          },
          {
            label: "Product Team"
          },
          {
            label: "Marketing Team"
          }
        ]
      }
    ]
  },
  milestones: {
    milestone: [
      {
        date: "2/11/2018",
        taskid: "4",
        color: "#F2726F",
        shape: "star",
        tooltext: "Prototyping Approved"
      },
      {
        date: "3/11/2018",
        taskid: "6",
        color: "#F2726F",
        shape: "star",
        tooltext: "Development Completed"
      },
      {
        date: "3/23/2018",
        taskid: "8",
        color: "#F2726F",
        shape: "star",
        tooltext: "UAT Tests Passed"
      },
      {
        date: "3/29/2018",
        taskid: "9",
        color: "#F2726F",
        shape: "star",
        tooltext: "Product Launched"
      }
    ]
  },
  tasks: {
    task: [
      {
        id: "1",
        start: "1/1/2018",
        end: "1/13/2018",
        color: "#5D62B5"
      },
      {
        id: "2",
        start: "1/4/2018",
        end: "1/21/2018",
        color: "#29C3BE"
      },
      {
        id: "3",
        start: "1/22/2018",
        end: "2/4/2018",
        color: "#5D62B5"
      },
      {
        id: "4",
        start: "2/5/2018",
        end: "2/11/2018",
        color: "#67CDF2"
      },
      {
        id: "5",
        start: "2/12/2018",
        end: "2/18/2018",
        color: "#FFC533"
      },
      {
        id: "6",
        start: "2/19/2018",
        end: "3/11/2018",
        color: "#67CDF2"
      },
      {
        id: "7",
        start: "3/12/2018",
        end: "3/18/2018",
        color: "#62B58F"
      },
      {
        id: "8",
        start: "3/16/2018",
        end: "3/23/2018",
        color: "#5D62B5"
      },
      {
        id: "9",
        start: "3/24/2018",
        end: "3/29/2018",
        color: "#29C3BE"
      }
    ]
  },
  processes: {
    align: "left",
    headertext: "Tasks",
    headervalign: "bottom",
    headeralign: "left",
    process: [
      {
        label: "PRD & User-Stories"
      },
      {
        label: "Persona & Journey"
      },
      {
        label: "Architecture"
      },
      {
        label: "Prototyping"
      },
      {
        label: "Design"
      },
      {
        label: "Development"
      },
      {
        label: "Testing & QA"
      },
      {
        label: "UAT Test"
      },
      {
        label: "Handover & Documentation"
      }
    ]
  },
  categories: [
    {
      category: [
        {
          start: "1/1/2018",
          end: "4/1/2018",
          label: "Project Pipeline for Q1-2018"
        }
      ]
    },
    {
      category: [
        {
          start: "1/1/2018",
          end: "1/31/2018",
          label: "Jan"
        },
        {
          start: "2/1/2018",
          end: "2/28/2018",
          label: "Feb"
        },
        {
          start: "3/1/2018",
          end: "4/1/2018",
          label: "Mar"
        }
      ]
    },
    {
      category: [
        {
          start: "1/1/2018",
          end: "1/7/2018",
          label: "Week 1"
        },
        {
          start: "1/8/2018",
          end: "1/14/2018",
          label: "Week 2"
        },
        {
          start: "1/15/2018",
          end: "1/21/2018",
          label: "Week 3"
        },
        {
          start: "1/22/2018",
          end: "1/28/2018",
          label: "Week 4"
        },
        {
          start: "1/29/2018",
          end: "2/4/2018",
          label: "Week 5"
        },
        {
          start: "2/5/2018",
          end: "2/11/2018",
          label: "Week 6"
        },
        {
          start: "2/12/2018",
          end: "2/18/2018",
          label: "Week 7"
        },
        {
          start: "2/19/2018",
          end: "2/25/2018",
          label: "Week 8"
        },
        {
          start: "2/26/2018",
          end: "3/4/2018",
          label: "Week 9"
        },
        {
          start: "3/5/2018",
          end: "3/11/2018",
          label: "Week 10"
        },
        {
          start: "3/12/2018",
          end: "3/18/2018",
          label: "Week 11"
        },
        {
          start: "3/19/2018",
          end: "3/25/2018",
          label: "Week 12"
        },
        {
          start: "3/26/2018",
          end: "4/1/2018",
          label: "Week 13"
        }
      ]
    }
  ]
};

FusionCharts.ready(function() {
  var myChart = new FusionCharts({
    type: "gantt",
    renderAt: "chart-container",
    width: "100%",
    height: "100%",
    dataFormat: "json",
    dataSource
  }).render();
});
HTML:
<div id="chart-container"></div>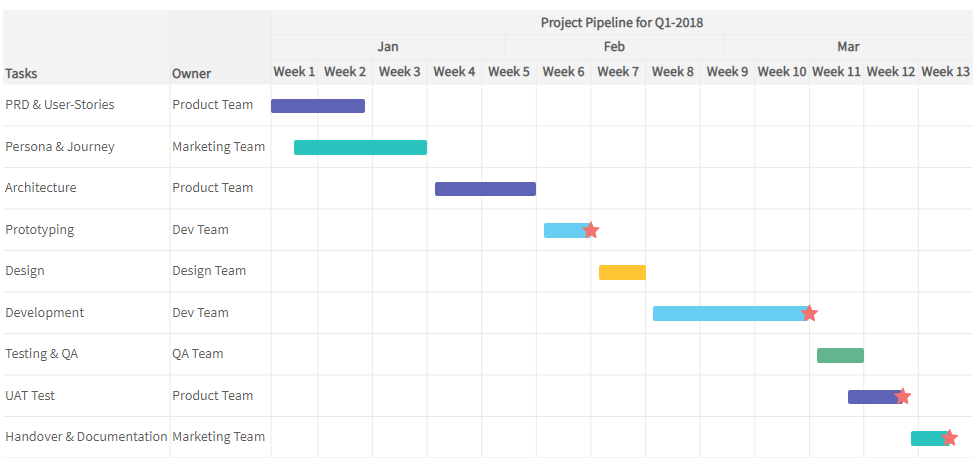
How can I show dependent tasks in a Gantt chart?
Javascript:
const dataSource = {
  chart: {
    caption: "New Store Opening - Project Plan",
    dateformat: "dd/mm/yyyy",
    outputdateformat: "ddds mns yy",
    ganttwidthpercent: "60",
    ganttpaneduration: "40",
    ganttpanedurationunit: "d",
    useverticalscrolling: "0",
    plottooltext: "<b>$label</b><br>Start: <b>$start</b><br>End: <b>$end</b>",
    theme: "fusion"
  },
  connectors: [
    {
      connector: [
        {
          fromtaskid: "1-1",
          totaskid: "2-1",
          color: "#F2726F",
          thickness: "2"
        },
        {
          fromtaskid: "2-1",
          totaskid: "3-1",
          color: "#F2726F",
          thickness: "2"
        },
        {
          fromtaskid: "3-1",
          totaskid: "4-1",
          color: "#F2726F",
          thickness: "2"
        },
        {
          fromtaskid: "4-1",
          totaskid: "5-1",
          color: "#F2726F",
          thickness: "2"
        },
        {
          fromtaskid: "5-1",
          totaskid: "6-1",
          color: "#F2726F",
          thickness: "2"
        },
        {
          fromtaskid: "6-1",
          totaskid: "7-1",
          color: "#F2726F",
          thickness: "2"
        },
        {
          fromtaskid: "7-1",
          totaskid: "8-1",
          color: "#F2726F",
          thickness: "2"
        },
        {
          fromtaskid: "8-1",
          totaskid: "9-1",
          color: "#F2726F",
          thickness: "2"
        },
        {
          fromtaskid: "9-1",
          totaskid: "10-1",
          color: "#F2726F",
          thickness: "2"
        }
      ]
    }
  ],
  trendlines: [
    {
      line: [
        {
          start: "14/4/2018",
          displayvalue: "AC Testing",
          color: "5D5D5D",
          thickness: "1",
          dashed: "1"
        }
      ]
    }
  ],
  milestones: {
    milestone: [
      {
        date: "30/4/2018",
        taskid: "10-1",
        color: "#f8bd19",
        shape: "star",
        tooltext: "Store Opening"
      }
    ]
  },
  tasks: {
    task: [
      {
        label: "Clear Site (4 Days)",
        processid: "1",
        start: "1/3/2018",
        end: "5/3/2018",
        id: "1-1",
        color: "#5D62B5"
      },
      {
        label: "Drainage & Foundation (7 Days)",
        processid: "2",
        start: "6/3/2018",
        end: "13/3/2018",
        id: "2-1",
        color: "#5D62B5"
      },
      {
        label: "Ground Floor (8 Days)",
        processid: "3",
        start: "14/3/2018",
        end: "22/3/2018",
        id: "3-1",
        color: "#5D62B5"
      },
      {
        label: "First Floor (5 Days)",
        processid: "4",
        start: "23/3/2018",
        end: "28/3/2018",
        id: "4-1",
        color: "#5D62B5"
      },
      {
        label: "Roofing (5 Days)",
        processid: "5",
        start: "29/3/2018",
        end: "3/4/2018",
        id: "5-1",
        color: "#5D62B5"
      },
      {
        label: "Connect Electricity (6 Days)",
        processid: "6",
        start: "4/4/2018",
        end: "10/4/2018",
        id: "6-1",
        color: "#5D62B5"
      },
      {
        label: "Air Conditioning (3 Days)",
        processid: "7",
        start: "11/4/2018",
        end: "14/4/2018",
        id: "7-1",
        color: "#5D62B5"
      },
      {
        label: "Interiors (8 Days)",
        processid: "8",
        start: "15/4/2018",
        end: "23/4/2018",
        id: "8-1",
        color: "#5D62B5"
      },
      {
        label: "Racking (3 Days)",
        processid: "9",
        start: "24/4/2018",
        end: "28/4/2018",
        id: "9-1",
        color: "#5D62B5"
      },
      {
        label: "Stock Shelving (1 Days)",
        processid: "10",
        start: "29/4/2018",
        end: "30/4/2018",
        id: "10-1",
        color: "#5D62B5",
        toppadding: "9"
      }
    ]
  },
  processes: {
    headertext: "Task",
    isanimated: "1",
    headervalign: "bottom",
    headeralign: "left",
    align: "left",
    isbold: "1",
    bgalpha: "25",
    process: [
      {
        label: "Clear site",
        id: "1"
      },
      {
        label: "Drainage & Foundation",
        id: "2"
      },
      {
        label: "Ground Floor",
        id: "3"
      },
      {
        label: "First Floor",
        id: "4"
      },
      {
        label: "Roofing",
        id: "5"
      },
      {
        label: "Connect Electricity",
        id: "6"
      },
      {
        label: "Air Conditioning",
        id: "7"
      },
      {
        label: "Interiors",
        id: "8"
      },
      {
        label: "Racking",
        id: "9"
      },
      {
        label: "Stock Shelving",
        id: "10"
      }
    ]
  },
  categories: [
    {
      align: "middle",
      category: [
        {
          start: "1/3/2018",
          end: "31/3/2018",
          label: "March"
        },
        {
          start: "1/4/2018",
          end: "1/5/2018",
          label: "April"
        }
      ]
    },
    {
      align: "center",
      category: [
        {
          start: "1/3/2018",
          end: "7/3/2018",
          label: "Week 1"
        },
        {
          start: "8/3/2018",
          end: "14/3/2018",
          label: "Week 2"
        },
        {
          start: "15/3/2018",
          end: "21/3/2018",
          label: "Week 3"
        },
        {
          start: "22/3/2018",
          end: "28/3/2018",
          label: "Week 4"
        },
        {
          start: "29/3/2018",
          end: "5/4/2018",
          label: "Week 5"
        },
        {
          start: "6/4/2018",
          end: "12/4/2018",
          label: "Week 6"
        },
        {
          start: "13/4/2018",
          end: "19/4/2018",
          label: "Week 7"
        },
        {
          start: "19/4/2018",
          end: "25/4/2018",
          label: "Week 8"
        },
        {
          start: "25/4/2018",
          end: "1/5/2018",
          label: "Week 9"
        }
      ]
    }
  ]
};

FusionCharts.ready(function() {
  var myChart = new FusionCharts({
    type: "gantt",
    renderAt: "chart-container",
    width: "100%",
    height: "100%",
    dataFormat: "json",
    dataSource
  }).render();
});
HTML:
<div id="chart-container"></div>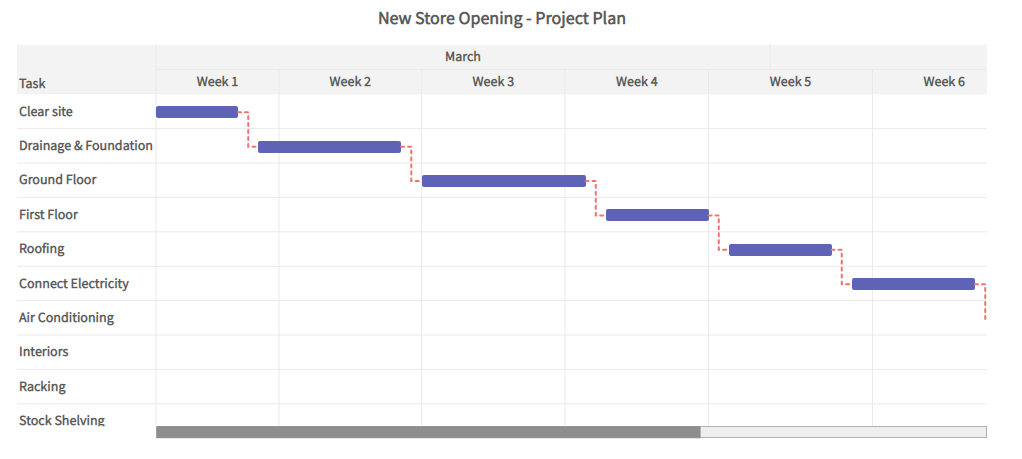
How can I configure a timeline like a machine operating schedule in a Gantt chart?
Javascript:
const dataSource = {
  chart: {
    caption: "Machine Operating Schedule For Sun Industries",
    subcaption: "Denver Plant",
    theme: "fusion",
    dateformat: "dd/mm/yyyy",
    plottooltext: "Status for period <b>$start - $end</b> is <b>$label</b>"
  },
  legend: {
    item: [
      {
        label: "In use",
        color: "#62B58D"
      },
      {
        label: "Repair",
        color: "#FFC533"
      },
      {
        label: "Idle",
        color: "#F2726F"
      }
    ]
  },
  tasks: {
    task: [
      {
        label: "In Use",
        processid: "A",
        start: "1/1/2018",
        end: "13/1/2018",
        bordercolor: "#62B58D",
        color: "#62B58D",
        id: "1"
      },
      {
        label: "Idle",
        processid: "A",
        start: "13/1/2018",
        end: "18/1/2018",
        bordercolor: "#F2726F",
        color: "#F2726F",
        id: "2"
      },
      {
        label: "In Use",
        processid: "A",
        start: "18/1/2018",
        end: "27/1/2018",
        bordercolor: "#62B58D",
        color: "#62B58D",
        id: "3"
      },
      {
        label: "Repair",
        processid: "A",
        start: "27/1/2018",
        end: "29/1/2018",
        bordercolor: "#FFC533",
        color: "#FFC533",
        id: "4"
      },
      {
        label: "In Use",
        processid: "A",
        start: "29/1/2018",
        end: "4/2/2018",
        bordercolor: "#62B58D",
        color: "#62B58D",
        id: "5"
      },
      {
        label: "Idle",
        processid: "B",
        start: "1/1/2018",
        end: "7/1/2018",
        bordercolor: "#F2726F",
        color: "#F2726F",
        id: "6"
      },
      {
        label: "In Use",
        processid: "B",
        start: "7/1/2018",
        end: "18/1/2018",
        bordercolor: "#62B58D",
        color: "#62B58D",
        id: "7"
      },
      {
        label: "Repair",
        processid: "B",
        start: "18/1/2018",
        end: "24/1/2018",
        bordercolor: "#FFC533",
        color: "#FFC533",
        id: "8"
      },
      {
        label: "In Use",
        processid: "B",
        start: "24/1/2018",
        end: "4/2/2018",
        bordercolor: "#62B58D",
        color: "#62B58D",
        id: "9"
      },
      {
        label: "Idle",
        processid: "C",
        start: "1/1/2018",
        end: "14/1/2018",
        bordercolor: "#F2726F",
        color: "#F2726F",
        id: "10"
      },
      {
        label: "In Use",
        processid: "C",
        start: "14/1/2018",
        end: "3/2/2018",
        bordercolor: "#62B58D",
        color: "#62B58D",
        id: "11"
      },
      {
        label: "Idle",
        processid: "C",
        start: "3/2/2018",
        end: "4/2/2018",
        bordercolor: "#F2726F",
        color: "#F2726F",
        id: "12"
      },
      {
        label: "Repair",
        processid: "D",
        start: "1/1/2018",
        end: "7/1/2018",
        bordercolor: "#FFC533",
        color: "#FFC533",
        id: "13"
      },
      {
        label: "Idle",
        processid: "D",
        start: "7/1/2018",
        end: "11/1/2018",
        bordercolor: "#F2726F",
        color: "#F2726F",
        id: "14"
      },
      {
        label: "In Use",
        processid: "D",
        start: "11/1/2018",
        end: "27/1/2018",
        bordercolor: "#62B58D",
        color: "#62B58D",
        id: "15"
      },
      {
        label: "Repair",
        processid: "D",
        start: "27/1/2018",
        end: "4/2/2018",
        bordercolor: "#FFC533",
        color: "#FFC533",
        id: "16"
      },
      {
        label: "Idle",
        processid: "E",
        start: "1/1/2018",
        end: "18/1/2018",
        bordercolor: "#F2726F",
        color: "#F2726F",
        id: "17"
      },
      {
        label: "In Use",
        processid: "E",
        start: "18/1/2018",
        end: "3/2/2018",
        bordercolor: "#62B58D",
        color: "#62B58D",
        id: "18"
      },
      {
        label: "Idle",
        processid: "E",
        start: "3/2/2018",
        end: "4/2/2018",
        bordercolor: "#F2726F",
        color: "#F2726F",
        id: "19"
      },
      {
        label: "In Use",
        processid: "F",
        start: "1/1/2018",
        end: "8/1/2018",
        bordercolor: "#62B58D",
        color: "#62B58D",
        id: "20"
      },
      {
        label: "Repair",
        processid: "F",
        start: "8/1/2018",
        end: "11/1/2018",
        bordercolor: "#FFC533",
        color: "#FFC533",
        id: "21"
      },
      {
        label: "In Use",
        processid: "F",
        start: "11/1/2018",
        end: "18/1/2018",
        bordercolor: "#62B58D",
        color: "#62B58D",
        id: "22"
      },
      {
        label: "Repair",
        processid: "F",
        start: "18/1/2018",
        end: "21/1/2018",
        bordercolor: "#FFC533",
        color: "#FFC533",
        id: "23"
      },
      {
        label: "Idle",
        processid: "F",
        start: "21/1/2018",
        end: "4/2/2018",
        bordercolor: "#F2726F",
        color: "#F2726F",
        id: "24"
      },
      {
        label: "In Use",
        processid: "G",
        start: "1/1/2018",
        end: "13/1/2018",
        bordercolor: "#62B58D",
        color: "#62B58D",
        id: "25"
      },
      {
        label: "Idle",
        processid: "G",
        start: "13/1/2018",
        end: "20/1/2018",
        bordercolor: "#F2726F",
        color: "#F2726F",
        id: "26"
      },
      {
        label: "In Use",
        processid: "G",
        start: "20/1/2018",
        end: "27/1/2018",
        bordercolor: "#62B58D",
        color: "#62B58D",
        id: "27"
      },
      {
        label: "Repair",
        processid: "G",
        start: "27/1/2018",
        end: "4/2/2018",
        bordercolor: "#FFC533",
        color: "#FFC533",
        id: "28"
      },
      {
        label: "In Use",
        processid: "H",
        start: "1/1/2018",
        end: "8/1/2018",
        bordercolor: "#62B58D",
        color: "#62B58D",
        id: "29"
      },
      {
        label: "Idle",
        processid: "H",
        start: "8/1/2018",
        end: "18/1/2018",
        bordercolor: "#F2726F",
        color: "#F2726F",
        id: "30"
      },
      {
        label: "In Use",
        processid: "H",
        start: "18/1/2018",
        end: "27/1/2018",
        bordercolor: "#62B58D",
        color: "#62B58D",
        id: "31"
      },
      {
        label: "Repair",
        processid: "H",
        start: "27/1/2018",
        end: "29/1/2018",
        bordercolor: "#FFC533",
        color: "#FFC533",
        id: "32"
      },
      {
        label: "In Use",
        processid: "H",
        start: "29/1/2018",
        end: "4/2/2018",
        bordercolor: "#62B58D",
        color: "#62B58D",
        id: "33"
      }
    ]
  },
  processes: {
    isbold: "1",
    headertext: "Machines",
    process: [
      {
        label: "Machine A",
        id: "A"
      },
      {
        label: "Machine B",
        id: "B"
      },
      {
        label: "Machine C",
        id: "C"
      },
      {
        label: "Machine D",
        id: "D"
      },
      {
        label: "Machine E",
        id: "E"
      },
      {
        label: "Machine F",
        id: "F"
      },
      {
        label: "Machine G",
        id: "G"
      },
      {
        label: "Machine H",
        id: "H"
      }
    ]
  },
  categories: [
    {
      category: [
        {
          start: "1/1/2018",
          end: "4/2/2018",
          name: "January 2018"
        }
      ]
    },
    {
      bgalpha: "0",
      category: [
        {
          start: "1/1/2018",
          end: "7/1/2018",
          label: "Week 1"
        },
        {
          start: "8/1/2018",
          end: "14/1/2018",
          label: "Week 2"
        },
        {
          start: "15/1/2018",
          end: "21/1/2018",
          label: "Week 3"
        },
        {
          start: "22/1/2018",
          end: "28/1/2018",
          label: "Week 4"
        },
        {
          start: "29/1/2018",
          end: "4/2/2018",
          label: "Week 5"
        }
      ]
    }
  ]
};

FusionCharts.ready(function() {
  var myChart = new FusionCharts({
    type: "gantt",
    renderAt: "chart-container",
    width: "100%",
    height: "100%",
    dataFormat: "json",
    dataSource
  }).render();
});
HTML:
<div id="chart-container"></div>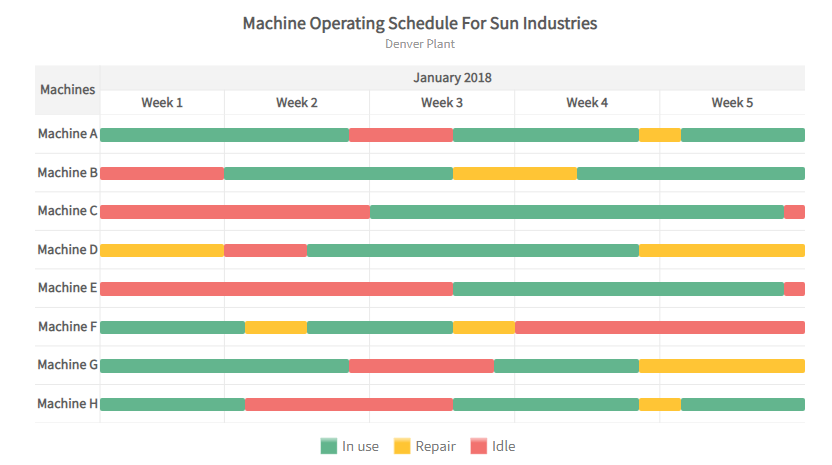
How can I build other types of Gantt charts using Javascript?
FusionCharts provides quite a few demos and examples of Gantt charts for a variety of front and back end languages including Javascript, React, Angular, jQuery, Vue, Ember, Svelte, React Native, AngularJS, PHP, Ruby on Rails, ASP.NET in C#, ASP.NET in VB, and Python. Learn more about all the other Gantt examples.
In this article, we looked at five different ways that you can configure a Gantt chart to display various kinds of task data. We saw how you can display weekly task distribution, hourly tasks, milestone indicators, dependent tasks, and machine operating schedules.
How can I get started building Gantt charts with Javascript?
FusionCharts offers beautiful charts and maps for your dashboards including Gantt charts. You get over 100+ charts, graphs, and gauges along with 2000+ choropleth maps and take your dashboard to a whole new level. Get all the variations of popular charts like Bar, Column, Line, Area, and Pie; or domain-specific charts like Treemaps, Heatmaps, Gantt Charts, Marimekko Charts, Gauges, Spider Charts, Waterfall Charts, and many more!
Head over and download the FusionCharts library to start building amazing Gantt charts today!
{
“@context”: “https://schema.org”,
“@type”: “FAQPage”,
“mainEntity”: [{
“@type”: “Question”,
“name”: “How can I build a weekly task distribution Gantt chart?”,
“acceptedAnswer”: {
“@type”: “Answer”,
“text”: “const dataSource = {
chart: {
caption: \”Weekly Maintenance Checks for Denver Plant\”,
subcaption: \”Sun Industries\”,
dateformat: \”mm/dd/yyyy hh:mm:ss\”,
outputdateformat: \”ddds mnl, yyyy hh12:mn ampm\”,
theme: \”fusion\”,
plottooltext: \”$label
Start: $start
End: $end\”
},
tasks: {
showlabels: \”0\”,
color: \”#5D62B5\”,
task: [
{
processid: \”MC7\”,
start: \”04/02/2018 12:00:00\”,
end: \”04/02/2018 23:00:00\”,
label: \”11 Hrs\”
},
{
processid: \”MC7\”,
start: \”04/04/2018 12:00:00\”,
end: \”04/04/2018 23:00:00\”,
label: \”11 Hrs\”
},
{
processid: \”MC7\”,
start: \”04/06/2018 12:00:00\”,
end: \”04/06/2018 23:00:00\”,
label: \”11 Hrs\”
},
{
processid: \”MC6\”,
start: \”04/02/2018 8:00:00\”,
end: \”04/02/2018 16:00:00\”,
label: \”8 Hrs\”
},
{
processid: \”MC6\”,
start: \”04/07/2018 8:00:00\”,
end: \”04/07/2018 16:00:00\”,
label: \”8 Hrs\”
},
{
processid: \”MC5\”,
start: \”04/04/2018 10:00:00\”,
end: \”04/04/2018 23:00:00\”,
label: \”13 Hrs\”
},
{
processid: \”MC4\”,
start: \”04/03/2018 13:30:00\”,
end: \”04/03/2018 22:30:00\”,
label: \”9 Hrs\”
},
{
processid: \”MC4\”,
start: \”04/06/2018 13:30:00\”,
end: \”04/06/2018 22:30:00\”,
label: \”9 Hrs\”
},
{
processid: \”MC3\”,
start: \”04/05/2018 11:30:00\”,
end: \”04/05/2018 22:30:00\”,
label: \”11 Hrs\”
},
{
processid: \”MC2\”,
start: \”04/07/2018 13:30:00\”,
end: \”04/07/2018 23:30:00\”,
label: \”10 Hrs\”
},
{
processid: \”MC1\”,
start: \”04/04/2018 11:45:00\”,
end: \”04/04/2018 23:45:00\”,
label: \”12 Hrs\”
}
]
},
processes: {
align: \”left\”,
headertext: \”Tasks\”,
headervalign: \”middle\”,
headeralign: \”left\”,
process: [
{
label: \”Bedplate Latch Bolts\”,
id: \”MC1\”
},
{
label: \”Bedplate Hydraulic Hoses\”,
id: \”MC2\”
},
{
label: \”Dust Stops Leakage\”,
id: \”MC3\”
},
{
label: \”Mixing Chamber Oiling\”,
id: \”MC4\”
},
{
label: \”Latch Stroke\”,
id: \”MC5\”
},
{
label: \”Latch Cylinder Leakage\”,
id: \”MC6\”
},
{
label: \”Latch Fastener Tightness\”,
id: \”MC7\”
}
]
},
categories: [
{
category: [
{
start: \”04/02/2018 00:00:00\”,
end: \”04/02/2018 23:59:59\”,
label: \”Monday\”
},
{
start: \”04/03/2018 00:00:00\”,
end: \”04/03/2018 23:59:59\”,
label: \”Tuesday\”
},
{
start: \”04/04/2018 00:00:00\”,
end: \”04/04/2018 23:59:59\”,
label: \”Wednesday\”
},
{
start: \”04/05/2018 00:00:00\”,
end: \”04/05/2018 23:59:59\”,
label: \”Thursday\”
},
{
start: \”04/06/2018 00:00:00\”,
end: \”04/06/2018 23:59:59\”,
label: \”Friday\”
},
{
start: \”04/07/2018 00:00:00\”,
end: \”04/07/2018 23:59:59\”,
label: \”Saturday\”
}
]
}
]
};
FusionCharts.ready(function() {
var myChart = new FusionCharts({
type: \”gantt\”,
renderAt: \”chart-container\”,
width: \”100%\”,
height: \”100%\”,
dataFormat: \”json\”,
dataSource
}).render();
});”
}
},{
“@type”: “Question”,
“name”: “How can I build an hourly tasks Gantt chart?”,
“acceptedAnswer”: {
“@type”: “Answer”,
“text”: “const dataSource = {
tasks: {
showlabels: \”1\”,
color: \”#5D62B5\”,
task: [
{
processid: \”EMP120\”,
start: \”07:00:00\”,
end: \”16:00:00\”,
label: \”Morning Shift\”
},
{
processid: \”EMP121\”,
start: \”14:00:00\”,
end: \”22:00:00\”,
label: \”Afternoon Shift\”
},
{
processid: \”EMP122\”,
start: \”14:00:00\”,
end: \”18:30:00\”,
label: \”Half Day\”
},
{
processid: \”EMP123\”,
start: \”07:00:00\”,
end: \”16:00:00\”,
label: \”Morning Shift\”
},
{
processid: \”EMP124\”,
start: \”14:00:00\”,
end: \”22:00:00\”,
label: \”Afternoon Shift\”
},
{
processid: \”EMP125\”,
start: \”00:00:00\”,
end: \”08:00:00\”,
label: \”Early Morning support\”
},
{
processid: \”EMP126\”,
start: \”07:00:00\”,
end: \”11:30:00\”,
label: \”Half Day\”
}
]
},
processes: {
fontsize: \”12\”,
isbold: \”1\”,
align: \”Center\”,
headertext: \”Employee\”,
headerfontsize: \”14\”,
headervalign: \”middle\”,
headeralign: \”left\”,
process: [
{
label: \”Betty\”,
id: \”EMP120\”
},
{
label: \”William\”,
id: \”EMP121\”
},
{
label: \”Emma\”,
id: \”EMP122\”
},
{
label: \”Oliver\”,
id: \”EMP123\”
},
{
label: \”Lucas\”,
id: \”EMP124\”
},
{
label: \”Alex\”,
id: \”EMP125\”
},
{
label: \”John\”,
id: \”EMP126\”
}
]
},
categories: [
{
category: [
{
start: \”00:00:00\”,
end: \”23:59:59\”,
label: \”Time\”
}
]
},
{
align: \”center\”,
category: [
{
start: \”00:00:00\”,
end: \”02:59:59\”,
label: \”Midnight\”
},
{
start: \”03:00:00\”,
end: \”05:59:59\”,
label: \”3 AM\”
},
{
start: \”06:00:00\”,
end: \”08:59:59\”,
label: \”6 AM\”
},
{
start: \”09:00:00\”,
end: \”11:59:59\”,
label: \”9 AM\”
},
{
start: \”12:00:00\”,
end: \”14:59:59\”,
label: \”12 PM\”
},
{
start: \”15:00:00\”,
end: \”17:59:59\”,
label: \”3 PM\”
},
{
start: \”18:00:00\”,
end: \”20:59:59\”,
label: \”6 PM\”
},
{
start: \”21:00:00\”,
end: \”23:59:59\”,
label: \”9 PM\”
}
]
}
],
chart: {
dateformat: \”dd/mm/yyyy\”,
outputdateformat: \”hh12:mn ampm\”,
caption: \”Shift Roster for June\”,
subcaption: \”Customer Success Team
Sensibill\”,
ganttpaneduration: \”22\”,
ganttpanedurationunit: \”h\”,
scrolltodate: \”09:00:00\”,
useverticalscrolling: \”0\”,
theme: \”fusion\”
}
};
FusionCharts.ready(function() {
var myChart = new FusionCharts({
type: \”gantt\”,
renderAt: \”chart-container\”,
width: \”100%\”,
height: \”100%\”,
dataFormat: \”json\”,
dataSource
}).render();
});”
}
},{
“@type”: “Question”,
“name”: “How can I build a milestone indicators Gantt chart?”,
“acceptedAnswer”: {
“@type”: “Answer”,
“text”: “const dataSource = {
chart: {
dateformat: \”mm/dd/yyyy\”,
theme: \”fusion\”,
useverticalscrolling: \”0\”
},
datatable: {
headervalign: \”bottom\”,
datacolumn: [
{
headertext: \”Owner\”,
headervalign: \”bottom\”,
headeralign: \”left\”,
align: \”left\”,
text: [
{
label: \”Product Team\”
},
{
label: \”Marketing Team\”
},
{
label: \”Product Team\”
},
{
label: \”Dev Team\”
},
{
label: \”Design Team\”
},
{
label: \”Dev Team\”
},
{
label: \”QA Team\”
},
{
label: \”Product Team\”
},
{
label: \”Marketing Team\”
}
]
}
]
},
milestones: {
milestone: [
{
date: \”2/11/2018\”,
taskid: \”4\”,
color: \”#F2726F\”,
shape: \”star\”,
tooltext: \”Prototyping Approved\”
},
{
date: \”3/11/2018\”,
taskid: \”6\”,
color: \”#F2726F\”,
shape: \”star\”,
tooltext: \”Development Completed\”
},
{
date: \”3/23/2018\”,
taskid: \”8\”,
color: \”#F2726F\”,
shape: \”star\”,
tooltext: \”UAT Tests Passed\”
},
{
date: \”3/29/2018\”,
taskid: \”9\”,
color: \”#F2726F\”,
shape: \”star\”,
tooltext: \”Product Launched\”
}
]
},
tasks: {
task: [
{
id: \”1\”,
start: \”1/1/2018\”,
end: \”1/13/2018\”,
color: \”#5D62B5\”
},
{
id: \”2\”,
start: \”1/4/2018\”,
end: \”1/21/2018\”,
color: \”#29C3BE\”
},
{
id: \”3\”,
start: \”1/22/2018\”,
end: \”2/4/2018\”,
color: \”#5D62B5\”
},
{
id: \”4\”,
start: \”2/5/2018\”,
end: \”2/11/2018\”,
color: \”#67CDF2\”
},
{
id: \”5\”,
start: \”2/12/2018\”,
end: \”2/18/2018\”,
color: \”#FFC533\”
},
{
id: \”6\”,
start: \”2/19/2018\”,
end: \”3/11/2018\”,
color: \”#67CDF2\”
},
{
id: \”7\”,
start: \”3/12/2018\”,
end: \”3/18/2018\”,
color: \”#62B58F\”
},
{
id: \”8\”,
start: \”3/16/2018\”,
end: \”3/23/2018\”,
color: \”#5D62B5\”
},
{
id: \”9\”,
start: \”3/24/2018\”,
end: \”3/29/2018\”,
color: \”#29C3BE\”
}
]
},
processes: {
align: \”left\”,
headertext: \”Tasks\”,
headervalign: \”bottom\”,
headeralign: \”left\”,
process: [
{
label: \”PRD & User-Stories\”
},
{
label: \”Persona & Journey\”
},
{
label: \”Architecture\”
},
{
label: \”Prototyping\”
},
{
label: \”Design\”
},
{
label: \”Development\”
},
{
label: \”Testing & QA\”
},
{
label: \”UAT Test\”
},
{
label: \”Handover & Documentation\”
}
]
},
categories: [
{
category: [
{
start: \”1/1/2018\”,
end: \”4/1/2018\”,
label: \”Project Pipeline for Q1-2018\”
}
]
},
{
category: [
{
start: \”1/1/2018\”,
end: \”1/31/2018\”,
label: \”Jan\”
},
{
start: \”2/1/2018\”,
end: \”2/28/2018\”,
label: \”Feb\”
},
{
start: \”3/1/2018\”,
end: \”4/1/2018\”,
label: \”Mar\”
}
]
},
{
category: [
{
start: \”1/1/2018\”,
end: \”1/7/2018\”,
label: \”Week 1\”
},
{
start: \”1/8/2018\”,
end: \”1/14/2018\”,
label: \”Week 2\”
},
{
start: \”1/15/2018\”,
end: \”1/21/2018\”,
label: \”Week 3\”
},
{
start: \”1/22/2018\”,
end: \”1/28/2018\”,
label: \”Week 4\”
},
{
start: \”1/29/2018\”,
end: \”2/4/2018\”,
label: \”Week 5\”
},
{
start: \”2/5/2018\”,
end: \”2/11/2018\”,
label: \”Week 6\”
},
{
start: \”2/12/2018\”,
end: \”2/18/2018\”,
label: \”Week 7\”
},
{
start: \”2/19/2018\”,
end: \”2/25/2018\”,
label: \”Week 8\”
},
{
start: \”2/26/2018\”,
end: \”3/4/2018\”,
label: \”Week 9\”
},
{
start: \”3/5/2018\”,
end: \”3/11/2018\”,
label: \”Week 10\”
},
{
start: \”3/12/2018\”,
end: \”3/18/2018\”,
label: \”Week 11\”
},
{
start: \”3/19/2018\”,
end: \”3/25/2018\”,
label: \”Week 12\”
},
{
start: \”3/26/2018\”,
end: \”4/1/2018\”,
label: \”Week 13\”
}
]
}
]
};
FusionCharts.ready(function() {
var myChart = new FusionCharts({
type: \”gantt\”,
renderAt: \”chart-container\”,
width: \”100%\”,
height: \”100%\”,
dataFormat: \”json\”,
dataSource
}).render();
});”
}
},{
“@type”: “Question”,
“name”: “How can I show dependent tasks in a Gantt chart?”,
“acceptedAnswer”: {
“@type”: “Answer”,
“text”: “const dataSource = {
chart: {
caption: \”New Store Opening – Project Plan\”,
dateformat: \”dd/mm/yyyy\”,
outputdateformat: \”ddds mns yy\”,
ganttwidthpercent: \”60\”,
ganttpaneduration: \”40\”,
ganttpanedurationunit: \”d\”,
useverticalscrolling: \”0\”,
plottooltext: \”$label
Start: $start
End: $end\”,
theme: \”fusion\”
},
connectors: [
{
connector: [
{
fromtaskid: \”1-1\”,
totaskid: \”2-1\”,
color: \”#F2726F\”,
thickness: \”2\”
},
{
fromtaskid: \”2-1\”,
totaskid: \”3-1\”,
color: \”#F2726F\”,
thickness: \”2\”
},
{
fromtaskid: \”3-1\”,
totaskid: \”4-1\”,
color: \”#F2726F\”,
thickness: \”2\”
},
{
fromtaskid: \”4-1\”,
totaskid: \”5-1\”,
color: \”#F2726F\”,
thickness: \”2\”
},
{
fromtaskid: \”5-1\”,
totaskid: \”6-1\”,
color: \”#F2726F\”,
thickness: \”2\”
},
{
fromtaskid: \”6-1\”,
totaskid: \”7-1\”,
color: \”#F2726F\”,
thickness: \”2\”
},
{
fromtaskid: \”7-1\”,
totaskid: \”8-1\”,
color: \”#F2726F\”,
thickness: \”2\”
},
{
fromtaskid: \”8-1\”,
totaskid: \”9-1\”,
color: \”#F2726F\”,
thickness: \”2\”
},
{
fromtaskid: \”9-1\”,
totaskid: \”10-1\”,
color: \”#F2726F\”,
thickness: \”2\”
}
]
}
],
trendlines: [
{
line: [
{
start: \”14/4/2018\”,
displayvalue: \”AC Testing\”,
color: \”5D5D5D\”,
thickness: \”1\”,
dashed: \”1\”
}
]
}
],
milestones: {
milestone: [
{
date: \”30/4/2018\”,
taskid: \”10-1\”,
color: \”#f8bd19\”,
shape: \”star\”,
tooltext: \”Store Opening\”
}
]
},
tasks: {
task: [
{
label: \”Clear Site (4 Days)\”,
processid: \”1\”,
start: \”1/3/2018\”,
end: \”5/3/2018\”,
id: \”1-1\”,
color: \”#5D62B5\”
},
{
label: \”Drainage & Foundation (7 Days)\”,
processid: \”2\”,
start: \”6/3/2018\”,
end: \”13/3/2018\”,
id: \”2-1\”,
color: \”#5D62B5\”
},
{
label: \”Ground Floor (8 Days)\”,
processid: \”3\”,
start: \”14/3/2018\”,
end: \”22/3/2018\”,
id: \”3-1\”,
color: \”#5D62B5\”
},
{
label: \”First Floor (5 Days)\”,
processid: \”4\”,
start: \”23/3/2018\”,
end: \”28/3/2018\”,
id: \”4-1\”,
color: \”#5D62B5\”
},
{
label: \”Roofing (5 Days)\”,
processid: \”5\”,
start: \”29/3/2018\”,
end: \”3/4/2018\”,
id: \”5-1\”,
color: \”#5D62B5\”
},
{
label: \”Connect Electricity (6 Days)\”,
processid: \”6\”,
start: \”4/4/2018\”,
end: \”10/4/2018\”,
id: \”6-1\”,
color: \”#5D62B5\”
},
{
label: \”Air Conditioning (3 Days)\”,
processid: \”7\”,
start: \”11/4/2018\”,
end: \”14/4/2018\”,
id: \”7-1\”,
color: \”#5D62B5\”
},
{
label: \”Interiors (8 Days)\”,
processid: \”8\”,
start: \”15/4/2018\”,
end: \”23/4/2018\”,
id: \”8-1\”,
color: \”#5D62B5\”
},
{
label: \”Racking (3 Days)\”,
processid: \”9\”,
start: \”24/4/2018\”,
end: \”28/4/2018\”,
id: \”9-1\”,
color: \”#5D62B5\”
},
{
label: \”Stock Shelving (1 Days)\”,
processid: \”10\”,
start: \”29/4/2018\”,
end: \”30/4/2018\”,
id: \”10-1\”,
color: \”#5D62B5\”,
toppadding: \”9\”
}
]
},
processes: {
headertext: \”Task\”,
isanimated: \”1\”,
headervalign: \”bottom\”,
headeralign: \”left\”,
align: \”left\”,
isbold: \”1\”,
bgalpha: \”25\”,
process: [
{
label: \”Clear site\”,
id: \”1\”
},
{
label: \”Drainage & Foundation\”,
id: \”2\”
},
{
label: \”Ground Floor\”,
id: \”3\”
},
{
label: \”First Floor\”,
id: \”4\”
},
{
label: \”Roofing\”,
id: \”5\”
},
{
label: \”Connect Electricity\”,
id: \”6\”
},
{
label: \”Air Conditioning\”,
id: \”7\”
},
{
label: \”Interiors\”,
id: \”8\”
},
{
label: \”Racking\”,
id: \”9\”
},
{
label: \”Stock Shelving\”,
id: \”10\”
}
]
},
categories: [
{
align: \”middle\”,
category: [
{
start: \”1/3/2018\”,
end: \”31/3/2018\”,
label: \”March\”
},
{
start: \”1/4/2018\”,
end: \”1/5/2018\”,
label: \”April\”
}
]
},
{
align: \”center\”,
category: [
{
start: \”1/3/2018\”,
end: \”7/3/2018\”,
label: \”Week 1\”
},
{
start: \”8/3/2018\”,
end: \”14/3/2018\”,
label: \”Week 2\”
},
{
start: \”15/3/2018\”,
end: \”21/3/2018\”,
label: \”Week 3\”
},
{
start: \”22/3/2018\”,
end: \”28/3/2018\”,
label: \”Week 4\”
},
{
start: \”29/3/2018\”,
end: \”5/4/2018\”,
label: \”Week 5\”
},
{
start: \”6/4/2018\”,
end: \”12/4/2018\”,
label: \”Week 6\”
},
{
start: \”13/4/2018\”,
end: \”19/4/2018\”,
label: \”Week 7\”
},
{
start: \”19/4/2018\”,
end: \”25/4/2018\”,
label: \”Week 8\”
},
{
start: \”25/4/2018\”,
end: \”1/5/2018\”,
label: \”Week 9\”
}
]
}
]
};
FusionCharts.ready(function() {
var myChart = new FusionCharts({
type: \”gantt\”,
renderAt: \”chart-container\”,
width: \”100%\”,
height: \”100%\”,
dataFormat: \”json\”,
dataSource
}).render();
});”
}
},{
“@type”: “Question”,
“name”: “How can I configure a timeline like a machine operating schedule in a Gantt chart?”,
“acceptedAnswer”: {
“@type”: “Answer”,
“text”: “const dataSource = {
chart: {
caption: \”Machine Operating Schedule For Sun Industries\”,
subcaption: \”Denver Plant\”,
theme: \”fusion\”,
dateformat: \”dd/mm/yyyy\”,
plottooltext: \”Status for period $start – $end is $label\”
},
legend: {
item: [
{
label: \”In use\”,
color: \”#62B58D\”
},
{
label: \”Repair\”,
color: \”#FFC533\”
},
{
label: \”Idle\”,
color: \”#F2726F\”
}
]
},
tasks: {
task: [
{
label: \”In Use\”,
processid: \”A\”,
start: \”1/1/2018\”,
end: \”13/1/2018\”,
bordercolor: \”#62B58D\”,
color: \”#62B58D\”,
id: \”1\”
},
{
label: \”Idle\”,
processid: \”A\”,
start: \”13/1/2018\”,
end: \”18/1/2018\”,
bordercolor: \”#F2726F\”,
color: \”#F2726F\”,
id: \”2\”
},
{
label: \”In Use\”,
processid: \”A\”,
start: \”18/1/2018\”,
end: \”27/1/2018\”,
bordercolor: \”#62B58D\”,
color: \”#62B58D\”,
id: \”3\”
},
{
label: \”Repair\”,
processid: \”A\”,
start: \”27/1/2018\”,
end: \”29/1/2018\”,
bordercolor: \”#FFC533\”,
color: \”#FFC533\”,
id: \”4\”
},
{
label: \”In Use\”,
processid: \”A\”,
start: \”29/1/2018\”,
end: \”4/2/2018\”,
bordercolor: \”#62B58D\”,
color: \”#62B58D\”,
id: \”5\”
},
{
label: \”Idle\”,
processid: \”B\”,
start: \”1/1/2018\”,
end: \”7/1/2018\”,
bordercolor: \”#F2726F\”,
color: \”#F2726F\”,
id: \”6\”
},
{
label: \”In Use\”,
processid: \”B\”,
start: \”7/1/2018\”,
end: \”18/1/2018\”,
bordercolor: \”#62B58D\”,
color: \”#62B58D\”,
id: \”7\”
},
{
label: \”Repair\”,
processid: \”B\”,
start: \”18/1/2018\”,
end: \”24/1/2018\”,
bordercolor: \”#FFC533\”,
color: \”#FFC533\”,
id: \”8\”
},
{
label: \”In Use\”,
processid: \”B\”,
start: \”24/1/2018\”,
end: \”4/2/2018\”,
bordercolor: \”#62B58D\”,
color: \”#62B58D\”,
id: \”9\”
},
{
label: \”Idle\”,
processid: \”C\”,
start: \”1/1/2018\”,
end: \”14/1/2018\”,
bordercolor: \”#F2726F\”,
color: \”#F2726F\”,
id: \”10\”
},
{
label: \”In Use\”,
processid: \”C\”,
start: \”14/1/2018\”,
end: \”3/2/2018\”,
bordercolor: \”#62B58D\”,
color: \”#62B58D\”,
id: \”11\”
},
{
label: \”Idle\”,
processid: \”C\”,
start: \”3/2/2018\”,
end: \”4/2/2018\”,
bordercolor: \”#F2726F\”,
color: \”#F2726F\”,
id: \”12\”
},
{
label: \”Repair\”,
processid: \”D\”,
start: \”1/1/2018\”,
end: \”7/1/2018\”,
bordercolor: \”#FFC533\”,
color: \”#FFC533\”,
id: \”13\”
},
{
label: \”Idle\”,
processid: \”D\”,
start: \”7/1/2018\”,
end: \”11/1/2018\”,
bordercolor: \”#F2726F\”,
color: \”#F2726F\”,
id: \”14\”
},
{
label: \”In Use\”,
processid: \”D\”,
start: \”11/1/2018\”,
end: \”27/1/2018\”,
bordercolor: \”#62B58D\”,
color: \”#62B58D\”,
id: \”15\”
},
{
label: \”Repair\”,
processid: \”D\”,
start: \”27/1/2018\”,
end: \”4/2/2018\”,
bordercolor: \”#FFC533\”,
color: \”#FFC533\”,
id: \”16\”
},
{
label: \”Idle\”,
processid: \”E\”,
start: \”1/1/2018\”,
end: \”18/1/2018\”,
bordercolor: \”#F2726F\”,
color: \”#F2726F\”,
id: \”17\”
},
{
label: \”In Use\”,
processid: \”E\”,
start: \”18/1/2018\”,
end: \”3/2/2018\”,
bordercolor: \”#62B58D\”,
color: \”#62B58D\”,
id: \”18\”
},
{
label: \”Idle\”,
processid: \”E\”,
start: \”3/2/2018\”,
end: \”4/2/2018\”,
bordercolor: \”#F2726F\”,
color: \”#F2726F\”,
id: \”19\”
},
{
label: \”In Use\”,
processid: \”F\”,
start: \”1/1/2018\”,
end: \”8/1/2018\”,
bordercolor: \”#62B58D\”,
color: \”#62B58D\”,
id: \”20\”
},
{
label: \”Repair\”,
processid: \”F\”,
start: \”8/1/2018\”,
end: \”11/1/2018\”,
bordercolor: \”#FFC533\”,
color: \”#FFC533\”,
id: \”21\”
},
{
label: \”In Use\”,
processid: \”F\”,
start: \”11/1/2018\”,
end: \”18/1/2018\”,
bordercolor: \”#62B58D\”,
color: \”#62B58D\”,
id: \”22\”
},
{
label: \”Repair\”,
processid: \”F\”,
start: \”18/1/2018\”,
end: \”21/1/2018\”,
bordercolor: \”#FFC533\”,
color: \”#FFC533\”,
id: \”23\”
},
{
label: \”Idle\”,
processid: \”F\”,
start: \”21/1/2018\”,
end: \”4/2/2018\”,
bordercolor: \”#F2726F\”,
color: \”#F2726F\”,
id: \”24\”
},
{
label: \”In Use\”,
processid: \”G\”,
start: \”1/1/2018\”,
end: \”13/1/2018\”,
bordercolor: \”#62B58D\”,
color: \”#62B58D\”,
id: \”25\”
},
{
label: \”Idle\”,
processid: \”G\”,
start: \”13/1/2018\”,
end: \”20/1/2018\”,
bordercolor: \”#F2726F\”,
color: \”#F2726F\”,
id: \”26\”
},
{
label: \”In Use\”,
processid: \”G\”,
start: \”20/1/2018\”,
end: \”27/1/2018\”,
bordercolor: \”#62B58D\”,
color: \”#62B58D\”,
id: \”27\”
},
{
label: \”Repair\”,
processid: \”G\”,
start: \”27/1/2018\”,
end: \”4/2/2018\”,
bordercolor: \”#FFC533\”,
color: \”#FFC533\”,
id: \”28\”
},
{
label: \”In Use\”,
processid: \”H\”,
start: \”1/1/2018\”,
end: \”8/1/2018\”,
bordercolor: \”#62B58D\”,
color: \”#62B58D\”,
id: \”29\”
},
{
label: \”Idle\”,
processid: \”H\”,
start: \”8/1/2018\”,
end: \”18/1/2018\”,
bordercolor: \”#F2726F\”,
color: \”#F2726F\”,
id: \”30\”
},
{
label: \”In Use\”,
processid: \”H\”,
start: \”18/1/2018\”,
end: \”27/1/2018\”,
bordercolor: \”#62B58D\”,
color: \”#62B58D\”,
id: \”31\”
},
{
label: \”Repair\”,
processid: \”H\”,
start: \”27/1/2018\”,
end: \”29/1/2018\”,
bordercolor: \”#FFC533\”,
color: \”#FFC533\”,
id: \”32\”
},
{
label: \”In Use\”,
processid: \”H\”,
start: \”29/1/2018\”,
end: \”4/2/2018\”,
bordercolor: \”#62B58D\”,
color: \”#62B58D\”,
id: \”33\”
}
]
},
processes: {
isbold: \”1\”,
headertext: \”Machines\”,
process: [
{
label: \”Machine A\”,
id: \”A\”
},
{
label: \”Machine B\”,
id: \”B\”
},
{
label: \”Machine C\”,
id: \”C\”
},
{
label: \”Machine D\”,
id: \”D\”
},
{
label: \”Machine E\”,
id: \”E\”
},
{
label: \”Machine F\”,
id: \”F\”
},
{
label: \”Machine G\”,
id: \”G\”
},
{
label: \”Machine H\”,
id: \”H\”
}
]
},
categories: [
{
category: [
{
start: \”1/1/2018\”,
end: \”4/2/2018\”,
name: \”January 2018\”
}
]
},
{
bgalpha: \”0\”,
category: [
{
start: \”1/1/2018\”,
end: \”7/1/2018\”,
label: \”Week 1\”
},
{
start: \”8/1/2018\”,
end: \”14/1/2018\”,
label: \”Week 2\”
},
{
start: \”15/1/2018\”,
end: \”21/1/2018\”,
label: \”Week 3\”
},
{
start: \”22/1/2018\”,
end: \”28/1/2018\”,
label: \”Week 4\”
},
{
start: \”29/1/2018\”,
end: \”4/2/2018\”,
label: \”Week 5\”
}
]
}
]
};
FusionCharts.ready(function() {
var myChart = new FusionCharts({
type: \”gantt\”,
renderAt: \”chart-container\”,
width: \”100%\”,
height: \”100%\”,
dataFormat: \”json\”,
dataSource
}).render();
});”
}
},{
“@type”: “Question”,
“name”: “How can I build other types of Gantt charts using Javascript?”,
“acceptedAnswer”: {
“@type”: “Answer”,
“text”: “FusionCharts provides quite a few demos and examples of Gantt charts for a variety of front and back end languages including Javascript, React, Angular, jQuery, Vue, Ember, Svelte, React Native, AngularJS, PHP, Ruby on Rails, ASP.NET in C#, ASP.NET in VB, and Python. Learn more about all the other Gantt examples.
In this article, we looked at five different ways that you can configure a Gantt chart to display various kinds of task data. We saw how you can display weekly task distribution, hourly tasks, milestone indicators, dependent tasks, and machine operating schedules.”
}
},{
“@type”: “Question”,
“name”: “How can I get started building Gantt charts with Javascript?”,
“acceptedAnswer”: {
“@type”: “Answer”,
“text”: “FusionCharts offers beautiful charts and maps for your dashboards including Gantt charts. You get over 100+ charts, graphs, and gauges along with 2000+ choropleth maps and take your dashboard to a whole new level. Get all the variations of popular charts like Bar, Column, Line, Area, and Pie; or domain-specific charts like Treemaps, Heatmaps, Gantt Charts, Marimekko Charts, Gauges, Spider Charts, Waterfall Charts, and many more!”
}
}]
}