Gantt Charts
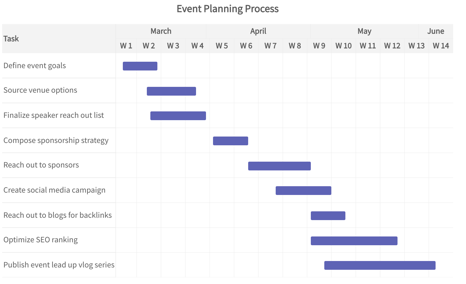
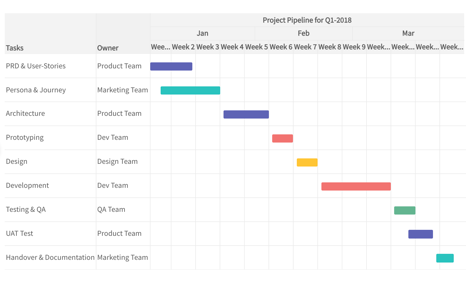
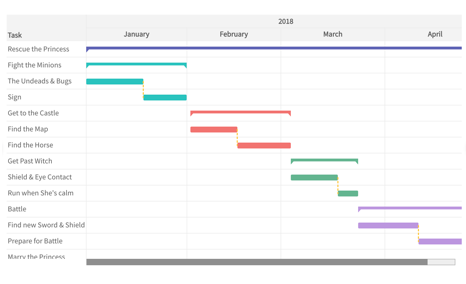
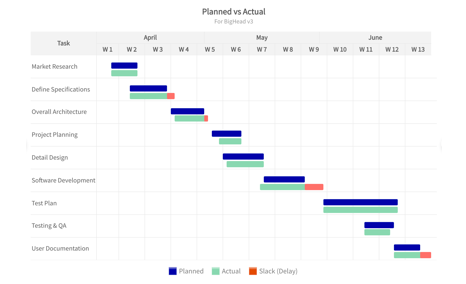
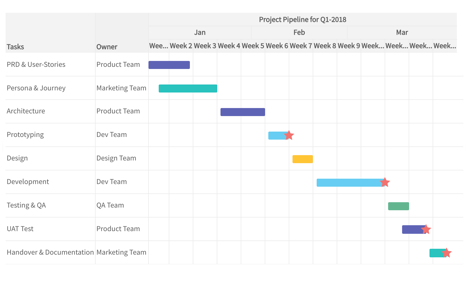
A Gantt chart is a visual view of tasks scheduled over time. Gantt charts are used for planning projects of all sizes and they are a useful way of showing what work is scheduled to be done on a specific day. They also help you view the start and end dates of a project in one simple view. On the left of the chart is a list of the activities and along the top is a suitable time scale. Each activity is represented by a bar; the position and length of the bar reflects the start date, duration and end date of the activity. This allows you to see at a glance:
- What the various activities are
- When each activity begins and ends
- How long each activity is scheduled to last
- Where activities overlap with other activities, and by how much
- The start and end date of the whole project
