Modern web applications depend on data visualization to transform complex information into clear, actionable insights. Whether you’re building business dashboards, analytics platforms, or real-time monitoring tools, the rendering technology behind your charts can have a major impact on performance and user experience.
When comparing Canvas vs SVG charts, developers often face a tradeoff between performance and interactivity. Canvas is known for handling large datasets and animations efficiently, while SVG excels at scalability, accessibility, and interactive features.
The right choice depends on your application’s requirements. In this guide, we’ll compare Canvas and SVG across performance, scalability, interactivity, and real-world use cases to help you determine which approach is best for your JavaScript charts.
Table of Contents
Key Takeaways
- Canvas and SVG use different rendering approaches. Canvas is pixel-based, while SVG uses scalable vector graphics.
- Canvas generally performs better with large datasets, real-time updates, and animations.
- SVG excels at interactivity, responsiveness, and accessibility, making it ideal for dashboards and business reporting.
- Neither technology is universally better. The right choice depends on your application’s performance and user experience requirements.
- Many modern JavaScript charting libraries combine the strengths of both approaches, helping developers build high-performance visualizations without managing rendering complexity directly.
Understanding Canvas and SVG
Before comparing Canvas vs SVG charts, it’s important to understand how each rendering technology works. Although both can be used to create interactive data visualizations, they take fundamentally different approaches to drawing graphics in the browser.
What Is Canvas?
Canvas is an HTML5 element that allows developers to draw graphics directly in the browser using JavaScript. Unlike SVG, which creates individual graphic elements, Canvas renders everything as pixels on a bitmap surface.
Canvas uses an immediate-mode graphics model. Once a shape is drawn, the browser doesn’t retain information about it as a separate object. Instead, the graphic becomes part of the canvas itself. This approach reduces DOM overhead and helps improve performance.
Because Canvas draws directly to a pixel-based surface, it is often the preferred choice for applications that require:
- Fast rendering performance
- Large dataset visualization
- Real-time updates
- Smooth animations
As a result, many high-performance JavaScript charts, financial dashboards, and monitoring systems use Canvas rendering to efficiently handle thousands of data points.
What Is SVG?
SVG (Scalable Vector Graphics) is an XML-based vector graphics format supported by all modern browsers. Instead of rendering graphics as pixels, SVG creates individual shapes, lines, and text elements that become part of the DOM.
Because SVG graphics are vector-based, they remain sharp and clear at any screen size or zoom level. Each chart element can also be styled, animated, and manipulated using CSS and JavaScript.
SVG is particularly well-suited for:
- Interactive charts and dashboards
- Responsive web applications
- Accessibility-focused visualizations
- Charts requiring extensive styling and customization
Since every visual element exists in the DOM, SVG charts offer built-in support for events such as clicks, hovers, and keyboard interactions. This makes them a popular choice for business dashboards, reports, and other interactive data visualization applications.
Canvas vs SVG Charts: Key Differences
While both Canvas and SVG can be used to create modern JavaScript charts, they differ significantly in how they render graphics, handle interactivity, and manage performance.
| Feature | Canvas | SVG |
|---|---|---|
| Rendering Method | Pixel-based | Vector-based |
| Performance | Excellent for large datasets | Better for smaller datasets |
| Scalability | Resolution-dependent | Infinitely scalable |
| DOM Elements | No | Yes |
| Accessibility | Limited | Better |
| Styling | JavaScript-based | CSS-friendly |
| Animation | Fast | Easier but less performant |
| Memory Usage | Lower | Higher |
The biggest difference between Canvas and SVG lies in their rendering approach. Canvas draws graphics directly onto a bitmap surface, making it highly efficient for rendering large volumes of data and frequent updates. SVG, on the other hand, creates individual vector elements within the DOM, providing greater flexibility for styling, accessibility, and user interactions.
As a general rule, Canvas is often preferred for high-performance, data-intensive applications, while SVG is better suited for interactive, responsive, and accessibility-focused charts. Understanding these tradeoffs is essential when choosing the right rendering technology for your data visualization project.
Performance Comparison: Canvas vs SVG Charts
Performance is often the deciding factor when choosing between Canvas and SVG charts. While both can create interactive data visualizations, they handle rendering very differently.
Handling Large Datasets
Canvas generally performs better when visualizing thousands of data points because it draws graphics directly onto a bitmap surface rather than creating individual DOM elements.
This makes Canvas a strong choice for:
- Heatmaps
- Financial charts
- Analytics platforms
- Real-time monitoring dashboards
SVG can become slower as the number of chart elements increases because each element is added to the DOM.
Memory Consumption
SVG stores every chart element as a DOM node, which increases memory usage as charts become more complex.
Canvas draws directly to a bitmap and does not maintain individual graphic objects, resulting in lower browser overhead and better efficiency for large datasets.
Real-Time Updates and Animations
Canvas is often preferred for applications that require frequent updates or animations, such as:
- Live dashboards
- IoT monitoring
- Stock market applications
Because Canvas redraws graphics directly, it can handle rapid updates more efficiently than SVG.
Interactivity and User Experience
While Canvas excels in performance, SVG often provides a better user experience for interactive applications.
Event Handling
SVG elements exist in the DOM, making it easy to add:
- Click events
- Hover effects
- Focus states
- Tooltips
With Canvas, developers must implement custom hit detection because chart elements are not individually accessible.
Styling Flexibility
SVG works naturally with CSS, making it easier to customize chart colors, animations, and visual styles.
Canvas styling is controlled through JavaScript, which can require more development effort.
Accessibility Considerations
SVG generally offers better accessibility because it supports:
- Screen readers
- ARIA attributes
- Keyboard navigation
Since Canvas graphics are rendered as pixels, additional work is often required to achieve the same level of accessibility.
When Should You Use SVG Charts?
SVG is ideal when interactivity, responsiveness, and accessibility are more important than raw rendering performance.
Small-to-Medium Data Visualizations
SVG works well for:
- Business reports
- Marketing dashboards
- KPI widgets
Highly Interactive Charts
SVG is a great choice for:
- Drill-down reports
- Educational tools
- Data exploration interfaces
Responsive Applications
Because SVG graphics scale without losing quality, they are well suited for:
- Retina displays
- Mobile devices
- Responsive dashboards
When Should You Use Canvas Charts?
Canvas is best suited for performance-focused applications.
Large Dataset Visualization
Canvas excels in:
- Big data dashboards
- Telemetry systems
- Analytics platforms
High-Frequency Updates
Canvas is commonly used for:
- Real-time monitoring
- Trading platforms
- Streaming analytics
Animation-Heavy Applications
Canvas is also ideal for:
- Interactive dashboards
- Live charting systems
- Gaming analytics
Its lightweight rendering model helps maintain smooth performance even under heavy workloads.
How Popular JavaScript Charting Libraries Use Canvas and SVG
Different JavaScript charting libraries use different rendering technologies depending on their goals and target use cases.
| Library | Rendering Method |
|---|---|
| FusionCharts | SVG + Performance Optimizations |
| Highcharts | SVG |
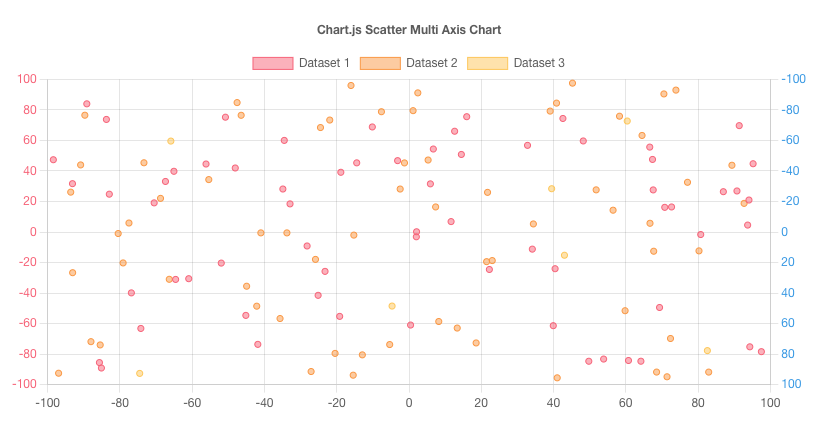
| Chart.js | Canvas |
| Apache ECharts | Canvas + SVG |
| D3.js | SVG (commonly) |
| Plotly.js | SVG + WebGL |
Libraries that rely primarily on SVG, such as FusionCharts, Highcharts, and D3.js, focus on interactivity, responsiveness, and accessibility. These libraries are often used for business dashboards, reports, and applications where user interaction is a priority.
Canvas-based libraries such as Chart.js prioritize rendering performance and are well suited for charts that display large datasets or require frequent updates.
Some modern JavaScript charting libraries take a hybrid approach. Apache ECharts supports both Canvas and SVG rendering, while Plotly.js combines SVG with WebGL for handling more demanding visualizations. This flexibility allows developers to choose the best rendering method for their specific use case.
Ultimately, the choice of charting library is often more important than choosing Canvas or SVG directly. A mature JavaScript charting library can optimize rendering, improve accessibility, and provide interactive features while abstracting much of the underlying complexity.
Compare the best JavaScript charting libraries for modern web applications.
Why Modern Developers Often Choose a Charting Library Instead of a Rendering Engine
Most developers don’t build charts directly with Canvas or SVG. Instead, they use a JavaScript charting library that handles rendering, interactivity, responsiveness, accessibility, and performance optimization.
Building charts from scratch can be complex and time-consuming. Modern charting libraries simplify development by providing ready-made components, cross-browser compatibility, exporting features, and built-in optimizations. This allows developers to focus on application logic rather than rendering details.
Conclusion
When comparing Canvas vs SVG charts, there is no single best option for every use case.
SVG excels at scalability, accessibility, and interactivity, while Canvas performs better with large datasets, real-time updates, and animations. The right choice depends on your application’s requirements.
Fortunately, many modern JavaScript charting libraries leverage the strengths of both technologies, helping developers build responsive and high-performance data visualizations without worrying about the underlying rendering engine.
FAQs
What is the difference between Canvas and SVG charts?
Canvas charts render graphics as pixels on a bitmap surface, while SVG charts render graphics as vector elements in the DOM. This affects performance, scalability, and interactivity.
Are Canvas charts faster than SVG charts?
Canvas charts are generally faster when rendering large datasets and frequent updates because they avoid creating large numbers of DOM elements.
When should I use SVG charts?
SVG charts are ideal for highly interactive, responsive, and accessible visualizations with small-to-medium-sized datasets.
Which JavaScript chart libraries use Canvas?
Popular Canvas-based libraries include Chart.js and Apache ECharts (default mode), while some libraries support both Canvas and SVG rendering.
What is the best rendering technology for enterprise dashboards?
It depends on the use case. SVG often works best for business dashboards and reporting tools, while Canvas is preferred for real-time analytics and data-intensive applications.