
According to renowned data journalist and TEDtalks speaker David McCandless, data speaks best through visuals rather than words. According to him, 80% percent of what we learn is absorbed visually, and research backs him up.
Three groups of economists took part in a study in which they were given the same dataset and asked the same questions. With only the data and standard statistical analysis, 72 percent of the group got the answer wrong. Another was given the data, the analysis, and a chart –errors dropped to 61%.
But (and here’s the catch) the final group had only the go-to chart. And only 3% answered incorrectly!
In this post, we’ll look at the significance of charts, how comparing data yields the best results, and how to select the appropriate data chart type for your data.
Table of Contents
Exploring the Importance of Charts
The power of charts to aid accurate interpretation is, to put it plainly, mindblowing. That’s why users across the globe are considering charts (or graphs) and pictorial representations to maximize the information at hand.
However, it could be a challenge to align visualizations to available datasets correctly, and the ultimate business needs.
The same numbers can be shown in several ways. When creating a dashboard, multiple charts must weave into a seamless fabric that together tells a story. This requires a clear understanding of information and what it must achieve. Does a visualization need to highlight differences? Should it highlight how one component fits into the whole? Does it need to show distribution? And should individual data points catch the eye?
These questions are, potentially, endless. But answering them accurately could save a lot of effort in the long run and prevent slip-ups that make the user question both accuracy and efficacy.
We did a quick breakdown of the most common use cases for data, which could be part of multiple business scenarios, and how best to visualize them.
Begin by asking the fundamental questions:
Are You Comparing Data?
Yes.
Yes.
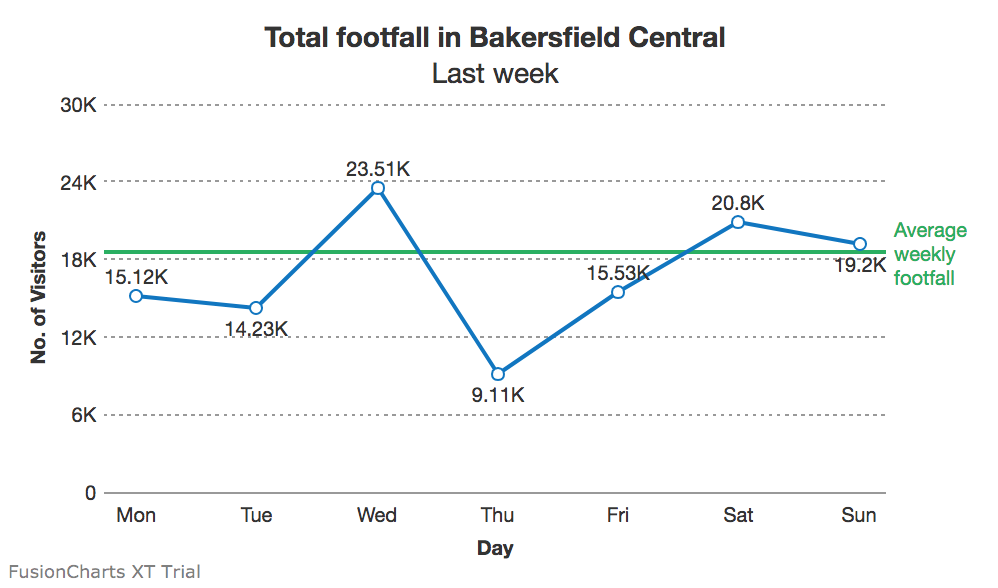
Also, as several lines can be plotted on the same canvas, line charts open possibilities of comparing multiple trends in one go.
However, more than 4-5 lines on the same chart could be distracting, and it’s difficult to zero in on specific values.
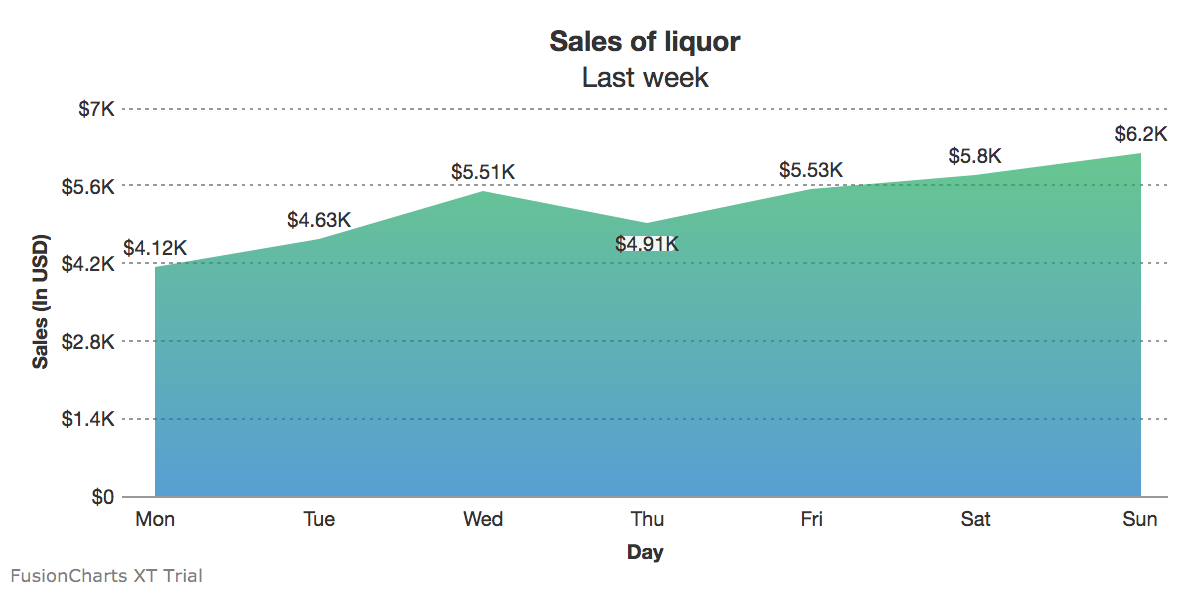
Tooltips, legends, and other contextual information should be intelligently used when creating area charts.
However, in the absence of direct lines drawn across the data points, these have emerged popular for non-linear data – population by capital cities, for example, or ROI from different departments.
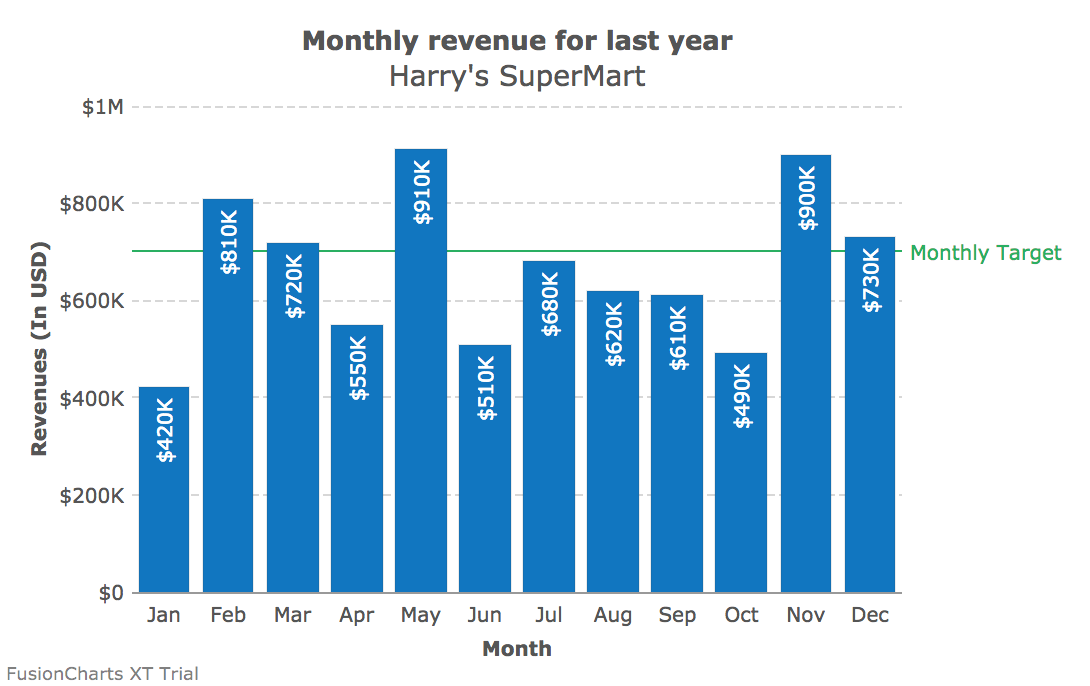
So, Column or Bar?
Given the amount of space available, bars and charts perform roughly the same function – however, in case of columns, it’s easier to spot if a data value is below a standard threshold.
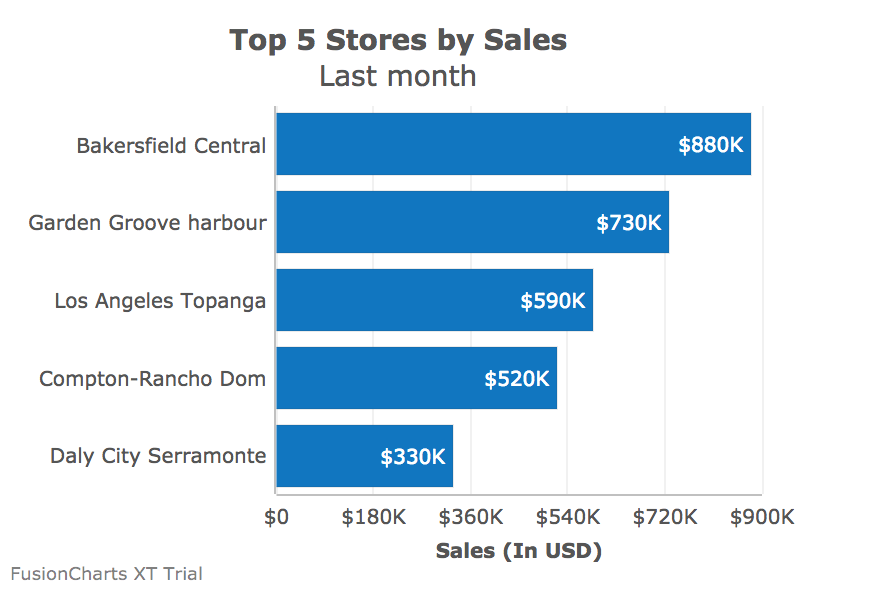
Bar charts are better suited to show if the data values have reached (or are close to reaching) a particular target. Additionally, bars can also hold a more substantial number of fields, without leading to clutter.
No more than comparison, the chart should accurately portray distribution and let the user draw her conclusions.
Do You Have to Show a Wide Range of Datasets?
No.
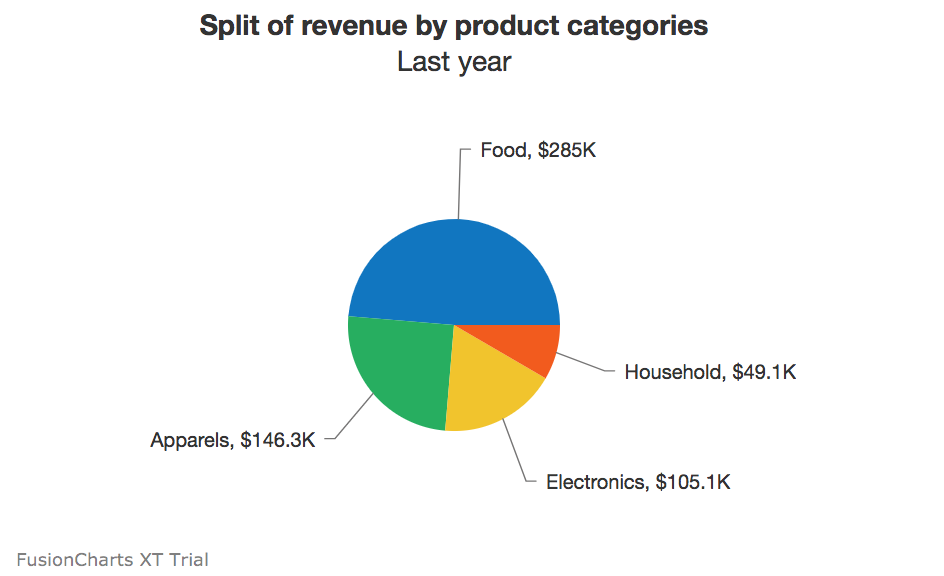
Avoid 3D imagery or tilt, as they interfere with the at-a-glance angle comparison pies are known for.
There’s also a comparative aspect to it – because the segments are arranged according to hierarchy, the user can quickly scan and derive insights.
Is Hierarchy Crucial to Your Data, With a Clear Top-Bottom Distribution?
Yes.
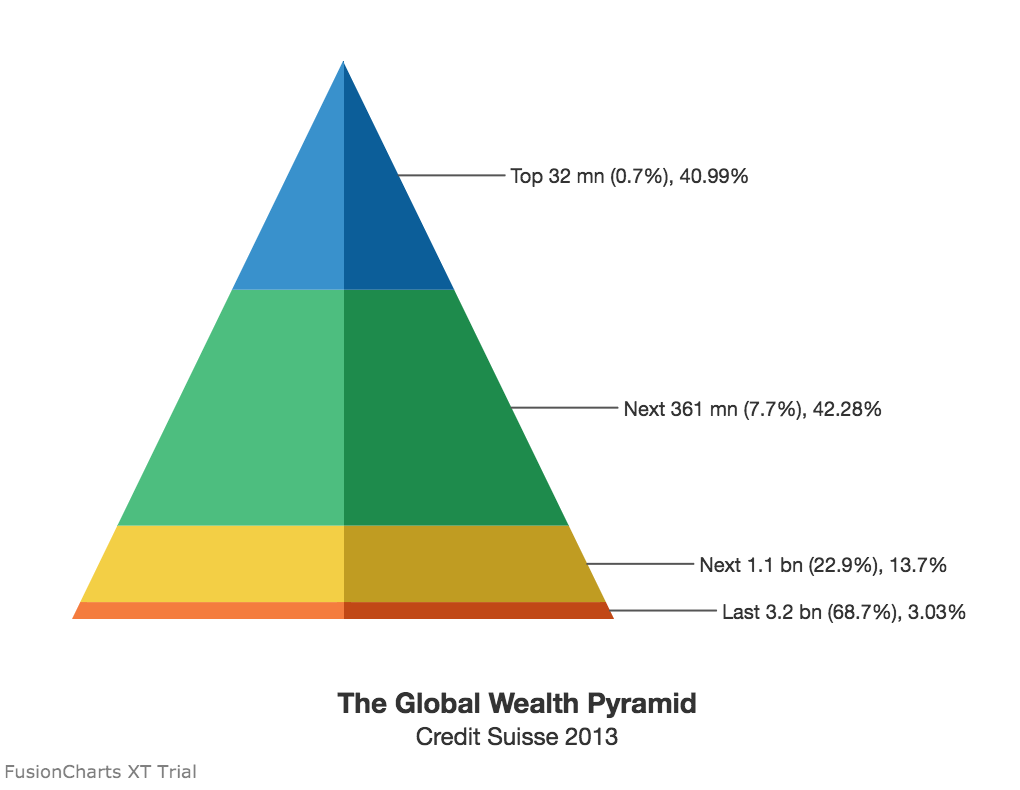
Take the archetypal food pyramid, where the staples are at the bottom, and infrequent components are at the top.
No, but the frequency of elements should stand out.
Word clouds are explicitly built to suggest frequency and distribution, without highlighting the actual numbers. A popular application is for SEO marketers – what are the key terms that pepper user conversations, and which words should take center stage when creating content?
As the deeper intricacies and detailed numbers are essentially ‘blackboxed,’ word clouds could be *technically* considered outside the scope of charts. However, they could prove to be a useful visualization tool in real business scenarios.
But Comparison and Distribution Have to go Hand-in-Hand
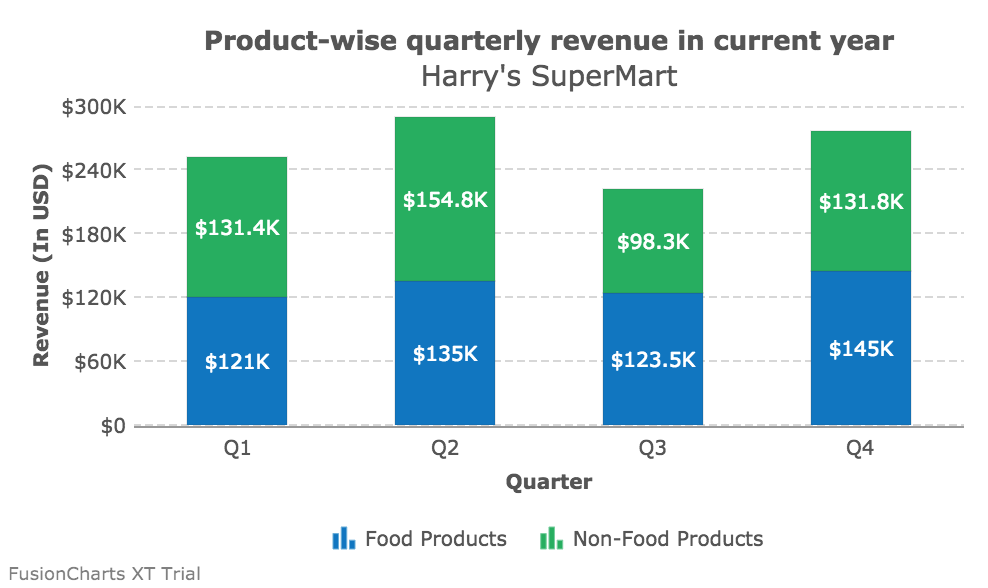
Take the simple instance of illustrating population – columns show how the total number changes year on year, while the stacks in each column indicate the flux in male and female numbers.
Yes, and the chart should plot how datasets with disparate units are changing
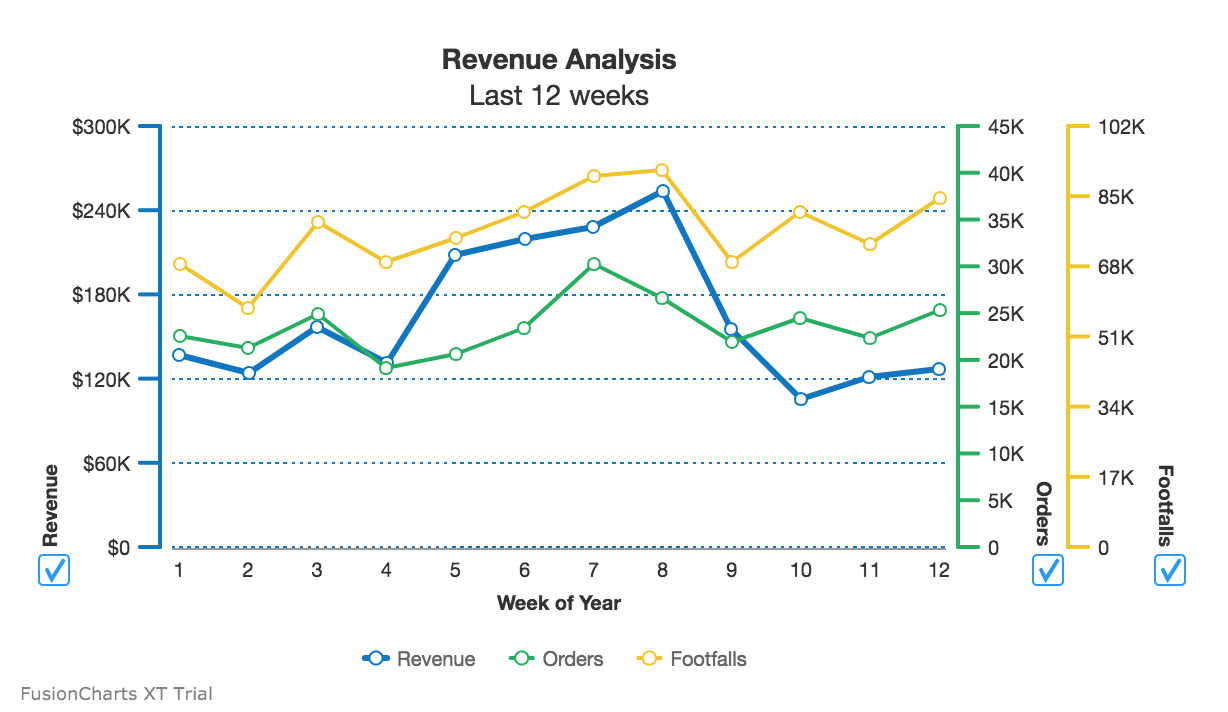
Dual Y-axis maps both datasets on a single canvas, allowing the user to spot possible patterns, combinations, and exceptions.
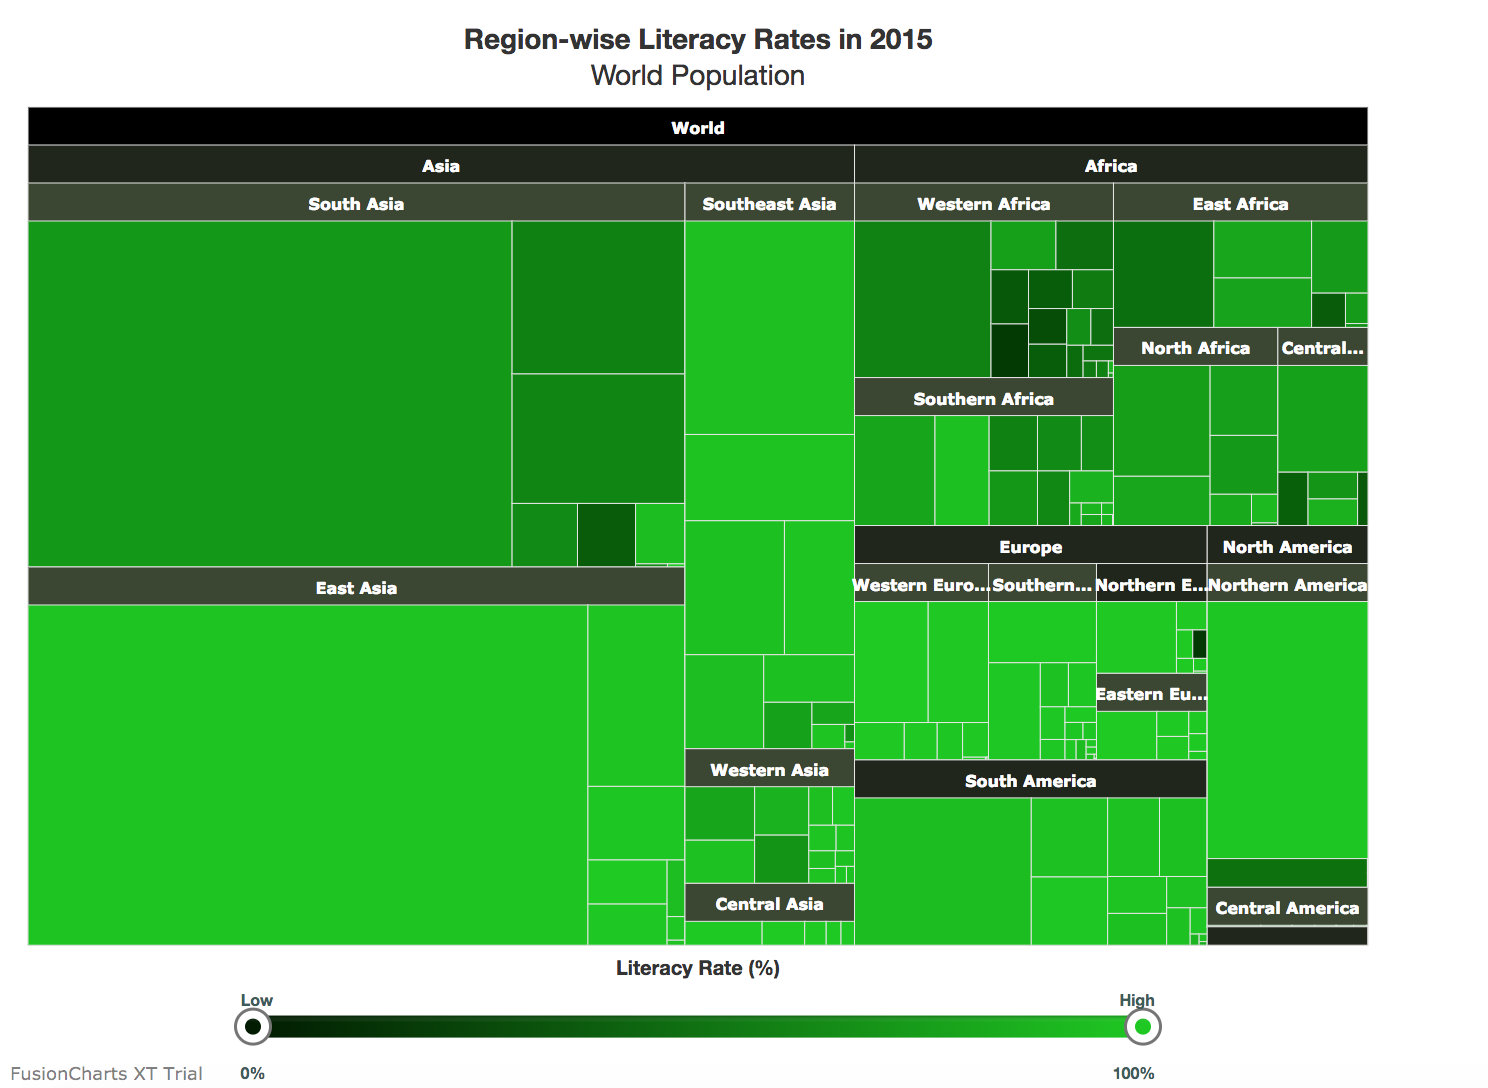
Too Many Numbers and All of Them are Critical!
Charts condense data into the very essentials and let users visualize the bigger picture. No matter how complex, charts must intelligently arrange data and include powerful drill-down capabilities for the user to explore the fundamentals.
That’s where the tables come in. They’re not meant to compete with the bold, colorful visuals of charts and word clouds.
However, they offer a set of unique benefits. These benefits include data searchability, combining detailed views and summaries in one snapshot, and the inescapable truth that almost everyone knows how to read a table.
Classifying Charts to Facilitate Better Chart Selection
The choice of charts is a function of the questions you’re attempting to answer, the data type, number of variables involved, variable type, the real estate available, and several other reasons. However, if you intend to show relationships, distribution, comparison or composition here’s a simplified representation of chart types mapped to various conditions. (source)
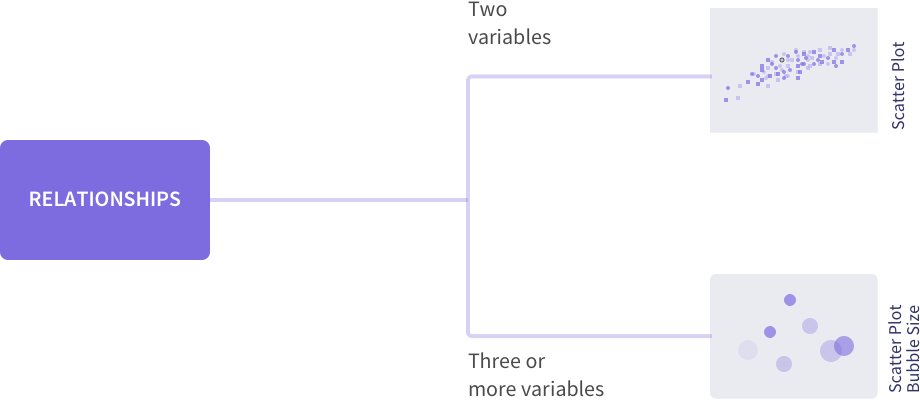
Charts to Show Relationships
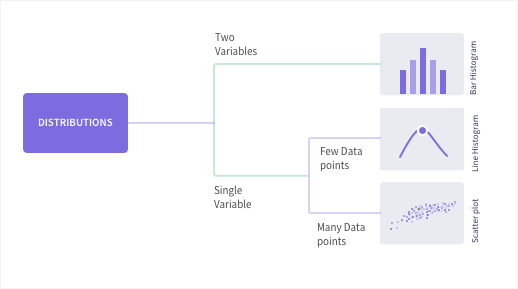
Distribution Charts
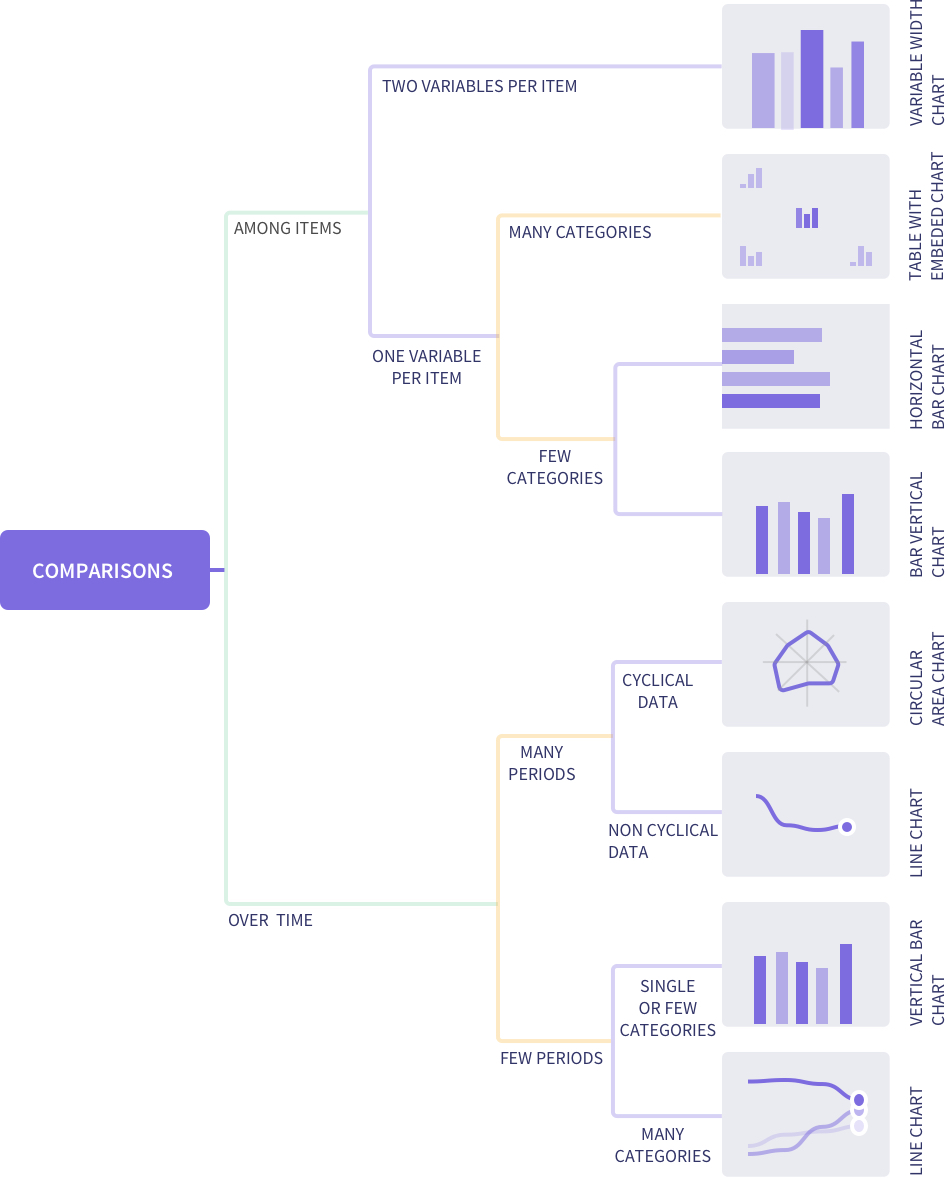
Data Comparison Charts
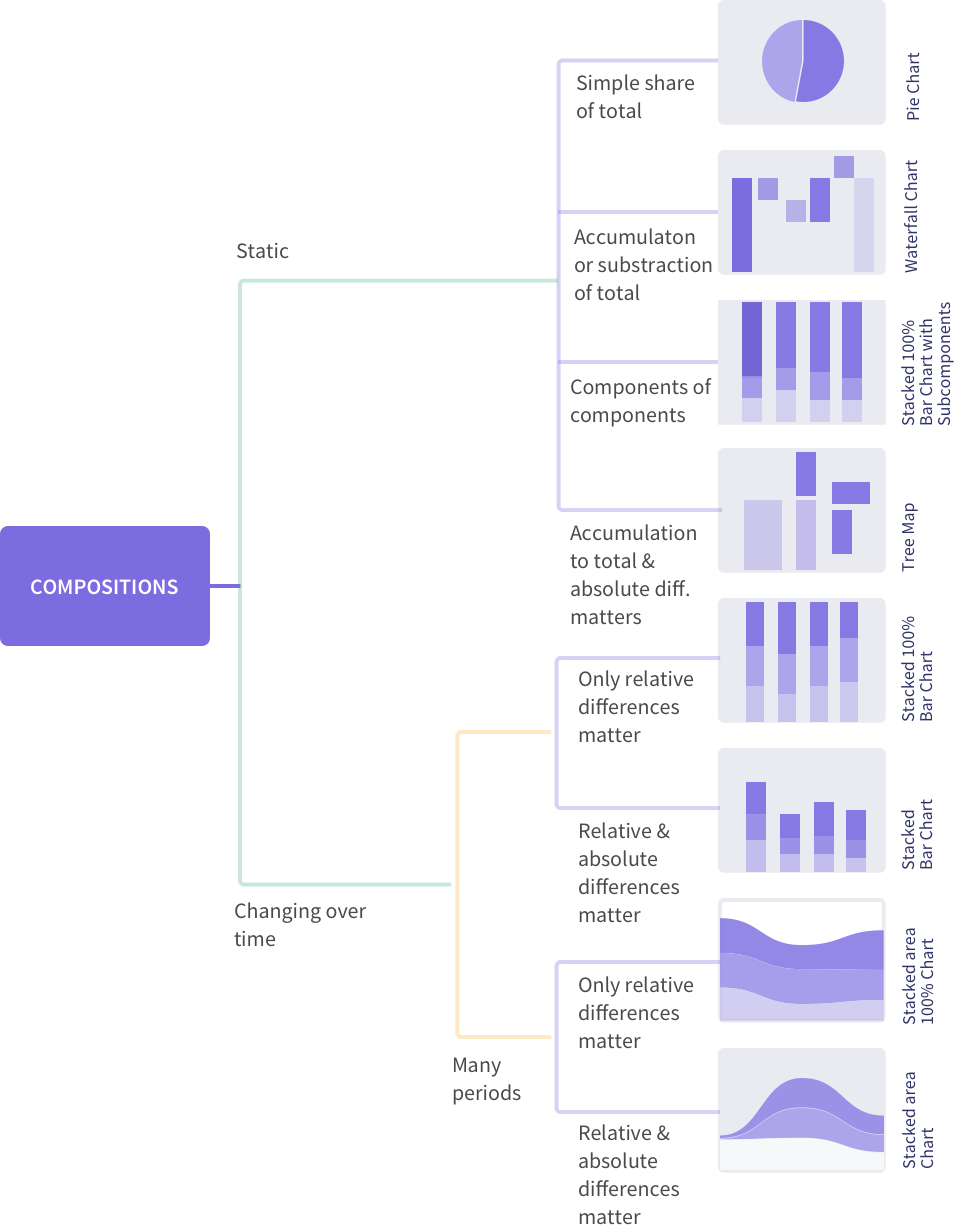
Charts to Represent Composition
With Data Visualization, There’s No One-Size-Fits-All Approach
These best practices could inspire innovative combinations. These combinations include employing charts with an eye on usability, instead of just ‘getting it right.’ And if the shoe fits, the result is a visualization that will become the next industry standard – like the sparkline.
At just 20 years old, give or take, sparklines are micro charts that sit beside tabular data. They visualize the numbers, in miniature.
One of its earliest documented applications was in 1998. The UI designer Peter Zelchenko used what he called ‘inlines’ to show stock price changes on a PC trading platform. The innovation went on to steal hearts, screens, and investments eventually becoming a global standard for a particular visualization use case.
So keep exploring un‘chart’ed territories, make way for new visualization ideas – the next sparkline might be just beyond the horizon.
If you’re wondering how to put these charts on the limited real estate of your information dashboard – here’s a comprehensive guide to designing dashboards that yield insights.


One response on “How to Choose the Right Chart Type for Your Data 2026”