Table of Contents
Introduction
To create pie charts and generate statistical data, you’ll find this list of the best pie chart makers useful.Pie charts are popular circular-shaped graphs used to visualize data. They are a critical component of business analysis and help in decision-making for different purposes. Today, there are a plethora of free online tools that take in your raw data and produce meaningful visualizations with minimal effort. Let’s dive right in and see the 3d pie chart makers you should consider.
What Is A Pie Chart?

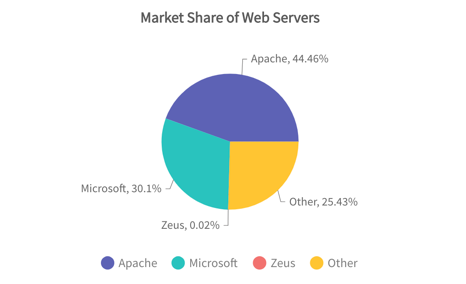
A pie chart is a circular-shaped chart created to demonstrate the part-whole relationship of data variables.
The chart is always rendered in the form of a circle with various slices that represent the categories. The entire circle of the pie chart visualizes the total quantity, while each section represents each variable (or category).
Also, each section’s arc size and length showcase how much of the total quantity the category occupies.
Pie charts are an essential element of data-driven analysis. They can be created in minutes using a 3d pie chart maker and deployed to interpret data for various use cases.
The Top Contenders: Evaluating 3D Pie Chart Maker Tools in 2024
Pie chart makers help you create a pie chart online with little effort.Here’s a list of the best ones you should consider:
FusionCharts
FusionCharts helps you create beautiful charts, graphs, and dashboards for your web or mobile projects.
This JavaScript charting library utilizes a programming language (JavaScript) to generate statistical data from beautiful, interactive pie charts.
Using FusionCharts, you can build easy-to-interpret pie charts in react native, angular, react, vue, and other JavaScript frameworks.
Plus, the library provides 100+ custom-built chart templates to help you get started quickly.
Whether you’re building for mobile or web, you can always leverage ready-to-use pie chart templates (available with source code), plug in your data, customize and create your own.
FusionCharts is available to small and large businesses, and you can start creating pie charts with a free trial.
Key Features
- Provides interactive charting experience
- Easily explore specific insights by zooming into time windows on axes.
- Understand data trends using vertical, horizontal, and regression lines.
- Share maps, gauges, and charts in multiple formats, streamlining data sharing
Pros
- FusionCharts Is XML Compatible
- We provide easy customization
- At FusionCharts, there is an availability of animated & interactive graphs.
Cons
- FusionCharts’ UI requires updating.
- Sometimes it is a little buggy
Pie Chart Maker by Designhill
Designhill’s Pie Chart Maker is a free online tool that helps you create beautiful, custom pie charts in minutes.The online pie chart maker offers a ton of layouts as well as customization options to create pie-doughnut charts, 3D pie charts, and others.
To get started, you only need to plug in your data variables. Then, edit the color, fonts, and photos.
Once that is done, the pie chart generator will generate a beautiful pie chart with sections with arch lengths corresponding to the variable represented.
That’s it. No professional design skills are needed to use the tool.
Designhill’s Pie Chart Maker is free to use.
Key Features
- The tool’s interface is intuitive & easy to navigate, making it simple for anyone to create pie charts.
- Designhill’s Pie Chart Maker offers a range of customization options, allowing you to adjust colors, labels, and other elements to suit your needs.
- Once you’ve created your pie chart, you can easily export it in various formats, including PNG, JPEG, PDF, and SVG.
Pros
- Designhill’s platform is user-friendly and intuitive, catering to users with no design experience.
- This platform offers budget-friendly contest packages, fixed-price projects, or hourly rates to suit diverse needs and budgets.
- Designhill presents access to a diverse network of designers worldwide, enhancing your chances of finding a designer who aligns perfectly with your brand vision.
Cons
- Only creates pie charts, restricting users to this specific data visualization format and neglecting other potentially more suitable options for different data sets.
- In the free version, some advanced features may be limited.
Visme
Visme offers a free and easy-to-use tool dedicated to creating visually appealing, professional pie charts.The pie chart generator allows you to generate pie charts in a few minutes. You can use several chart customization possibilities to make your visualization process as painless as possible.
Plus, you also get access to a library of attractive design templates to get off the ground fast.
To begin, you can plug in your project data manually. Or, if you’ve created a pie chart in Excel, you can simply import it into the Visme graph engine.
Then, add the data points, customize fonts or colors, and indicate data labels. Thanks to its templates and drag-and-drop widgets, you don’t need professional design skills to jumpstart. Visme is free to use, and you can get started by signing up using your social media account.Key Features
- Enhance user engagement with captivating 3D objects.
- Ensure data security with robust access controls and permissions.
- Monitor user interactions with an intuitive activity dashboard.
- Add dynamism to your platform with seamless animation integration.
Pros
- Streamline content creation process
- Intuitive user interface for ease of use
- High-quality design elements for enhanced visual appeal
Cons
- Potential design flaws affecting usability & aesthetics
- Restrictions on tailoring the product to individual preferences
RapidTables
RapidTables is an online pie chart maker available to generate statistical data.It offers a straightforward process to rapidly create a simple pie chart and get going. This tool is best for you if you’re on limited time.
One downside to using RapidTables is that it offers limited customization options and no pie chart templates.
To get started, choose the chart type you want to create, and enter your chart title, data labels, and data values. Then, draw the chart.
RapidTables is completely free to use and does not require you to sign up.
Key Features
- RapidTables offers a wide range of calculators for mathematics, physics, chemistry, and engineering.
- The website provides converters for various units of measurement, such as length, weight, volume, temperature, and more.
- RapidTables offers interactive charts and graphs for mathematics, science, and finance.
Pros
- RapidTables is accessible without any cost, making it budget-friendly for users.
- The platform provides diverse tools for various mathematical, scientific, and engineering calculations.
- RapidTables includes interactive visual representations that can enhance understanding of mathematical, scientific, and financial data.
Cons
- Users may find the ability to customize charts and graphs restricted, limiting their ability to tailor visualizations to specific needs.
- The website may display advertisements, distracting or disrupting the user experience.
- RapidTables may not offer certain advanced functionalities that more specialized or comprehensive software might provide.
Visual Paradigm
Visual Paradigm is an online free chart maker that drives easy and seamless data visualization.With this tool, you can edit any beautiful pie chart template in an intuitive spreadsheet editor and customize them to your desire.
Visual Paradigm allows you to make your chart beautiful by editing its fonts, colors, labels, and icon legend. Millions of stock photos and icons are available on its spreadsheet editor to spice up your design.
Visual Paradigm is free to use, and you can get started building pie charts with it in minutes.
Key Features
- Visual Paradigm provides various modeling tools, including UML diagrams, BPMN diagrams, ERD diagrams, and more, aiding teams in visualizing and designing software systems.
- The tool offers features for team collaboration, like team discussions, reviews, and version control, enabling effective teamwork regardless of location.
- Visual Paradigm includes tools for managing requirements throughout development, ensuring the final product meets stakeholders’ needs.
Pros
- Visual Paradigm offers a user-friendly interface, making it accessible for beginners and experienced users alike.
- The tool provides a comprehensive set of modeling tools, including UML diagrams, BPMN diagrams, ERD diagrams, and more.
- Visual Paradigm includes excellent collaboration features such as team discussions, reviews, and version control, facilitating effective teamwork.
Cons
- Visual Paradigm has a steep learning curve for beginners, requiring some time to become proficient.
- Some advanced features in Visual Paradigm may require additional training to fully utilize.
- Visual Paradigm has limited support for certain programming languages, which may be a drawback for some users.
HighCharts
Highcharts is a versatile data visualization tool offering various chart types, including line, bar, pie, and scatter plots. Its intuitive interface allows seamless interaction with charts, while responsive design ensures device compatibility. Extensive customization options enable users to tailor charts to their needs, from styling to advanced features like animations.With robust documentation and support resources, implementation is smooth, and troubleshooting is simplified. Highcharts stands out for its user-friendly interface, rich feature set, and strong community support, making it an outstanding option for businesses looking to improve their data visualization capabilities with 3d pie chart maker.
Key Features
- Supports a variety of chart types including line, bar, pie, and scatter plots.
- Automatically adjusts to different screen sizes and devices for seamless user experience.
- Provides comprehensive documentation and support resources for easy implementation and troubleshooting
Pros
- Renders charts quickly and efficiently, even with large datasets.
- Active community of users and developers providing support and sharing resources.
- Intuitive interface makes it easy for users to create and customize charts.
Cons
- Some features may not be fully supported in older browsers
- May require a paid license for commercial use, which can be a barrier for some users.
AnyChart
AnyChart is a comprehensive charting solution offering various features to create visually appealing and interactive charts. With AnyChart, users can quickly build charts, including lines, bars, pie charts, scatter charts, and more, suitable for diverse data visualization needs.One of its key features is its flexibility, allowing customization of every chart aspect, including colors, fonts, and labels. Additionally, AnyChart supports interactivity, enabling users to add tooltips, drill-down functionality, and interactive legends to enhance user engagement.
Key Features
- Powered by a state-of-the-art JavaScript API.
- Compatible with virtually all scripting languages, including ASP, PHP, ColdFusion, Perl, etc.
- Cross-platform and cross-browser compatibility.
- Free from dependencies
Pros
- Supports numerous chart types, making it suitable for various data visualization requirements.
- Adding interactive elements like tooltips and drill-down functionality enhances user engagement and comprehension.
- Seamlessly integrate into web, desktop, and mobile applications
Cons
- Despite its extensive features, mastering all aspects of AnyChart may require time and effort.
- While AnyChart offers a free trial, the full version may be comparatively expensive for some users, tiny businesses, or individuals.
Meta Chart
Meta-Chart offers an excellent solution for creating pie charts. With this 3D pie chart maker platform, users can quickly input data and generate pie charts that clearly depict the proportions of different elements. Its straightforward approach is ideal for users who value simple and effective data representation.Key Features
- Meta Chart offers diverse chart types, including bar charts, line graphs, pie charts, and more. This enables users to visualize data in a way that best suits their needs.
- Users can customize charts with various colors, fonts, and styles to create visually appealing presentations.
- Meta Chart allows multiple users to work on a chart simultaneously, making it ideal for team projects and collaborations.
Pros
- Meta Chart’s interface is intuitive and easy to access for all skill levels.
- Meta Charts can be used for various purposes, including business presentations, academic projects, and data analysis.
- The ability to collaborate in real-time makes Meta Chart a valuable tool for teams working on projects remotely.
Cons
- While Meta Chart offers some customization options, users may find that they are limited compared to other charting tools.
- Meta Chart is a web-based tool, so users need an internet connection to access and use it.
- Since Meta Chart requires users to upload data to the cloud, some users may have concerns about data privacy and security.
When To Use A Pie Chart
Pie charts are usually appropriate for any scenario where you need to represent categorical variables as percentages or showcase individual sections as part of a whole quantity.In this case, each categorical variable is represented as a section of the circle and adds up to the total quantity.
If this is not your situation, you might want to explore other chart types, such as column charts, bar charts, or line charts.
There are two critical cases where a pie chart should be used:- When you want to show a precise version of your data to the audience without giving importance to other slices.
- To showcase that one segment in the total performance is comparatively smaller than the other.
The Best Way To Use A Pie Chart
Here are some best practices you should follow when creating a pie chart to generate statistical data.Use Annotations
Tiny fractions and proportions will be challenging to interpret from a pie chart.This is why annotations and data labeling are best practices. You should add data labels to your sections and also create an icon legend where possible so your audience can smoothly understand your chart.
Slice Size & Order Matters
When creating pie charts, it’s best to arrange the categories according to their contribution to the whole quantity.You can do this by placing the largest slice at the top-right corner and arranging the rest in descending size order, from right to left.
Arranging the slices in your chart properly will make it easy for your audience to interpret.
Specify a Maximum Number Of Pie Slices
Pie charts with plenty of slices would be challenging for your audience to interpret.When creating your pie chart, you should represent a minimal amount of categories in the circle. A good range has five to ten categories.
Use Less Distortions & 3D Visual Effects
Excessive 3D visual effects can distort your custom pie chart and make it less readable.So you should completely avoid these distortions, and visual effects or ONLY use them when necessary.
Why Fusioncharts?
 FusionCharts stands out for its dependability, simplicity, interaction, and customization.
The JavaScript library offers you the right tools to build beautiful and interactive charts, graphs, and dashboards for the web or mobile.
Here are some reasons why 800,000+ developers use FusionCharts and why you should. Compare top solutions now!
Supports 100+ Chart Types
FusionCharts works with over 100 interactive chart types and 2000+ data-driven maps and offers popular data charts such as Pie, Bar, Column, Line, and Area charts. And you get access to domain-specific charts such as Treemaps, Heatmaps, Gantt Charts, Marimekko Charts, Spider Charts, and Waterfall Charts.Over 2000+ data-driven choropleth maps, which cover countries, counties, and even cities, are also available in FusionCharts.
Plenty of Customization Options
FusionCharts makes editing your chart and graphs easy thanks to its numerous customization possibilities.Every theme in the library can be customized to its tiniest bits to achieve the modern look and feel you desire.
You can also customize elements on your pie charts, such as data labels, captions, axis labels, icon legends, and data points to suit your visual needs.
Supports Chart Interaction Features
FusionCharts make creating interactive and responsive charts and maps easy, so your audience can have a better, user-friendly experience.The library supports interactivity features such as panning, zooming, scaling, and dragging.
Conclusion
In summary, pie charts are an important element of business analysis. They are an exciting way to communicate visually and illustrate data that add up to 100%.Creating them has never been easier, thanks to several online pie chart makers: FusionCharts, Designhill, Visme, RapidTables, and Visual Paradigm.
Some of these online tools have free versions and support a lot of layouts, chart types, and desired features. That said, Fusioncharts rises above the herd to focus on meeting your project needs. Download a trial today to get started.
FAQs
👉 What are pie charts used for?A: Pie charts show parts about a whole, with each slice representing a category’s percentage contribution. They work best with a few types (5-10), data in percentages, and a need to compare parts to the whole.
👉 When should I use FusionCharts over other pie chart makers?A: FusionCharts is ideal for its wide range of chart types, advanced customization, and interactive features, making it a superior choice over other 3d pie chart makers.
👉 Are there any free alternatives to FusionCharts?A: Yes, there are free alternatives to FusionCharts for pie chart creation. Designhill, Visme, RapidTables, and Visual Paradigm offer various free options with different features and customization levels.
Create Your 3D Pie Chart Today!
Ready to create stunning and interactive pie charts for your web or mobile projects? Try FusionCharts today and experience the simplicity, customization, and power of over 100 chart types. By using FusionCharts 3d pie chart maker, you can visualize your data like never before.Start your free trial now!


